As Australia moves towards mandatory climate reporting, understanding the complexities of emissions becomes paramount. From assessing Scope 1, 2 & 3 emissions to exploring carbon intensity across market segments, investors and advisers must grasp the nuances for informed decision-making. Head of RI & Sustainability, Dug Higgins, delves into the intricacies of emissions data, its implications for investment strategies, and the evolving landscape of sustainability in finance.
With Australia on the cusp of implementing mandatory climate reporting in financial statements, much has been written on what’s required, what’s included and who’s captured. While finalisation of the implementation phase is essential, so too will be educating the market on what these disclosures mean in practice. For investors and advisers, understanding a profit and loss statement or fund performance metrics is fairly straightforward. We’re now entering a new world where understanding the nuances of emissions reporting will be a necessary skill.
Sourcing emissions
We all know that Greenhouse Gas emissions come from a variety of sources, as can be illustrated here.
Global GHG emissions by sector
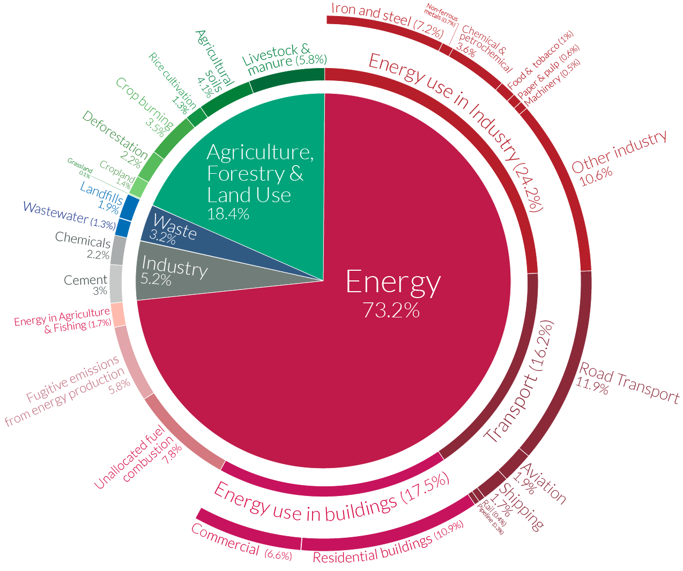
Source: OurWorldInData.org, 2020
But this is a system-wide picture. What does this mean when you get this data provided at a company or fund level?
Understanding a company or fund’s carbon footprint involves delving into the mysterious world of carbon measurement. To gain a comprehensive overview, entities must measure three distinct types of emissions:
- Scope 1- direct emissions from sources that are owned or controlled by the company, such as fuels burned on-site or company vehicles,
- Scope 2 - indirect emissions from the generation of purchased energy, primarily electricity, used by the company, and
- Scope 3 - all other indirect emissions that occur in the company’s value chain, such as business travel, procurement and waste.
While many companies and funds already report this data on a voluntary basis, under Australia’s proposed new climate reporting rules, this data will become mandatory for thousands of entities. So, like any data that’s considered material, investors will have to learn how to understand its context and relevance.
Balancing the scales of carbon exposure
For industry insiders, understanding relative exposures inside markets, such as country or sector is standard practice. Now we must consider carbon exposures. By employing metrics like Weighted Average Carbon Intensity (WACI), which measures tons of CO2 equivalents per million dollars of sales, we can start to see the relative ‘weight’ of carbon exposure within a market, and therefore a portfolio. Using MSCI data, we can also look at a series of indices to assess these characteristics. For example, the carbon intensity of the MSCI ACWI Index by sector weight provides valuable insights into carbon exposure levels.
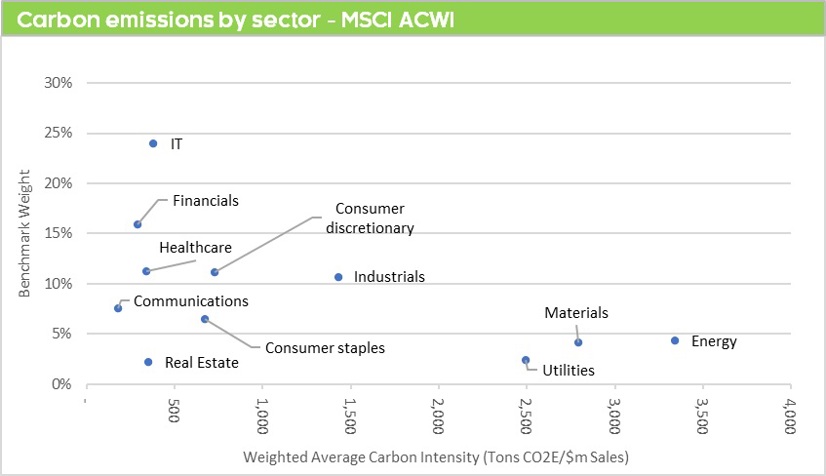
Source: MSCI
Moving past sector exposures, let’s explore equity market capitalisation sleeves. In the Australian market, carbon emissions tend to be more pronounced in large cap companies, whereas in global markets, they lean more to toward the smaller end of the spectrum. This is logical given the relative sectoral exposures in each market.
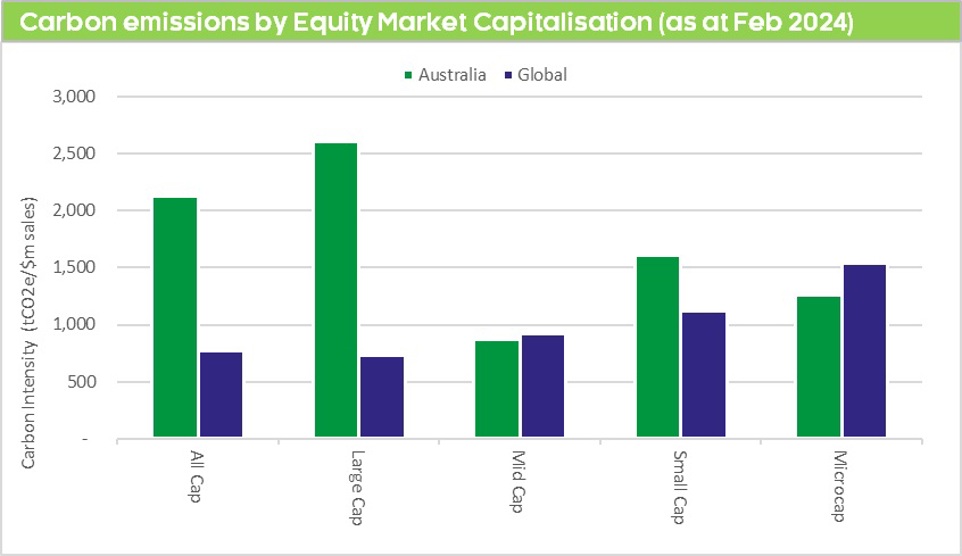
Source: MSCI
The point here is less about the actual carbon numbers, as these can change materially depending on methodology and data provider. More important is that investors and advisers start to develop a sense of what carbon intensity looks like on a relative basis across market segments. This understanding enables them to better grasp the potential biases inherent in specific funds and what constitutes a typical carbon profile.
This can be especially important if pursuing an ‘ESG’ strategy. While ESG can be interpreted in many ways, understanding that even across ESG indices, carbon reduction compared to the broader market can vary greatly, not just in terms of reduction in emissions intensity, but also stock diversification. As shown in the selection of MSCI indices below, the reduction in carbon intensity can be anything from 36% to 66%, a material spread. As with everything, outcomes will depend on portfolio design and objectives.
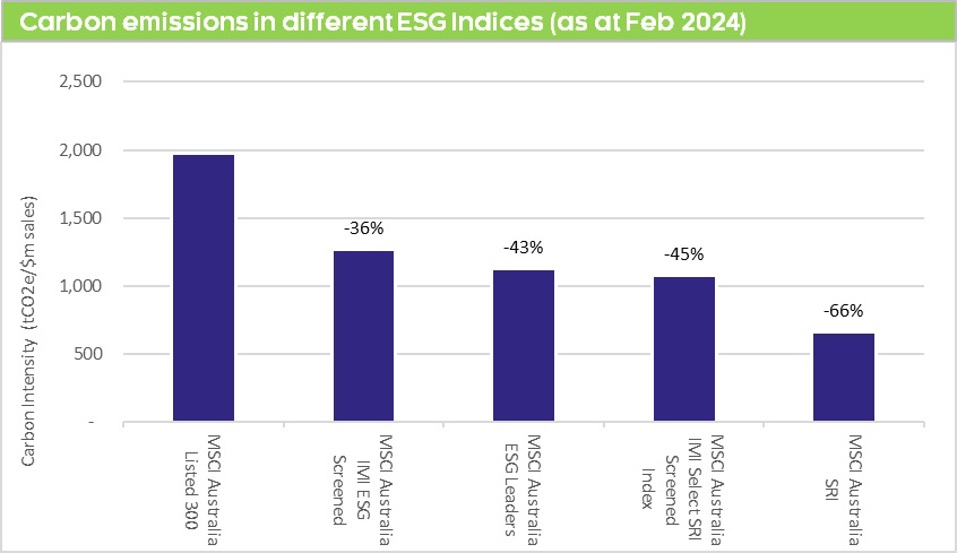
Source: MSCI
Navigating carbon complexity – not as easy as 1, 2, 3
While the concept of emissions relatively is simple, the realities are more complex. In the above charts, we have looked at estimates of total emissions inside market segments, Scope 1, 2 & 3. However, depending on the nature of operations, some sectors have radically more emissions coming from direct versus indirect sources. Looking at global markets, we can see that while energy, materials and utilities are still sitting heavily across all scopes, other market segments have minimal exposure to Scope 1 & 2 emissions, the bulk being indirect.
Carbon Emissions EVIC Intensity by MSCI ACWI IMI sector
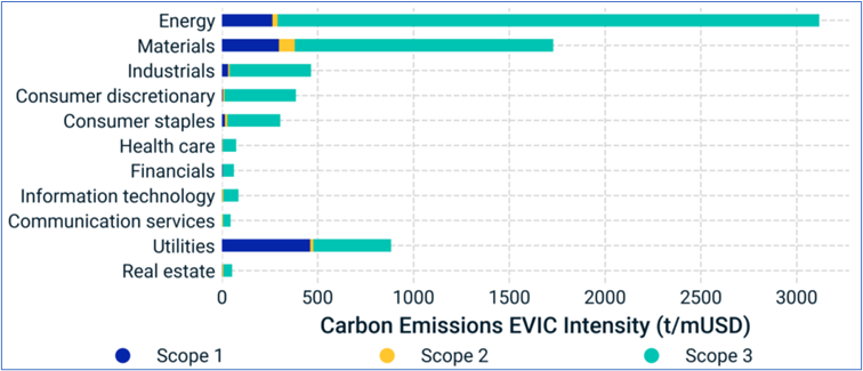
Source: MSCI ESG Research, as of Dec. 30, 2022
This highlights several critical points. You need to understand which ‘Scopes’ are included when assessing carbon data. Under the proposed Australian reporting rules, Scope 3 emissions are potentially only reportable if ‘material’. It also has a bearing on how easily (or not) a company or fund will be able to address any emissions reduction objectives. And lastly, it creates issues with cross-border disclosures. Some jurisdictions like Europe are mandating all scope emissions in reporting. Others, like the US, are proposing only Scope 1 & 2 be disclosed. The devil is in the detail.
The complexity deepens when considering there are various ratios that can be used in calculating carbon intensity. While standardised approaches like WACI offer consistency, they may not suit every scenario perfectly, creating loopholes that require careful navigation.
Overarching all of these data points is the necessity of understanding context. What does this number mean for me? What is its relevance to the fund I am assessing? Is it central to a thesis, or just supporting information? What do I measure it against? How does it support or detract from an investment strategy?
Why does this matter?
In a democratic world, not all investors care about sustainability in their investments or consider emissions data meaningful. Yet, emissions can serve as an indicator of other types of risk. High-emissions assets may face exposure to shifts in climate policies, energy prices and stakeholder sentiments, while lower-emissions assets can present distinct opportunities along with potential challenges.
Ultimately, emissions data is just another factor in the mix, seeking to illuminate what is material for a company. As investors, we need to be informed of these considerations, just as we do the contents of the traditional financial statement. Increasingly, we need to learn the language of sustainability to navigate a new shift in the disclosure landscape.
