A year into the MySuper era, there is no evidence emerging that the latest batch of low fee, passively managed super funds are delivering any additional value for their members. One year is too short a period to form a judgement, of course, but over the medium and longer term the better performing funds have been those that have focused on maximising their net returns, not on minimising their fees.
As has been the case for many years, most of the top performing growth funds in our database (those with 61 – 80% in growth assets) derived value from active management in traditional asset sectors and from a meaningful exposure to alternative and unlisted assets, including private equity, unlisted property and unlisted infrastructure.
There are no benchmark indices for these unlisted sectors, so passive management is not an option. Funds that use passive management to keep their fees low are effectively locked out of these investments. That is unfortunate for their members, because these sectors have delivered strong returns and diversification benefits over many years.
Active management does cost more, as does investment in unlisted assets, but there is plenty of evidence to show that the additional cost is justified. For example, a recent Chant West study compared the growth options of the 10 largest non-profit funds with a passive benchmark portfolio, using Vanguard’s growth fund as a proxy. The 10 largest non-profit funds were chosen because (a) they have meaningful allocations to unlisted assets, (b) they account for a significant portion of superannuation assets excluding SMSFs (about $360 billion of the total $1.2 trillion) and (c) they represent a large proportion of the overall super fund membership (about 10 million accounts out of the total 30 million). Among our findings were:
- The 10 largest non-profit funds’ returns, net of investment fees and tax, significantly outperformed the passive benchmark, for example, by 0.4% per annum over the 10 years to December 2014, as shown in Chart 1, and 0.8% per annum over 15 years. To put this performance differential in more practical terms, assuming a balance of $30,000 at age 30, and taking into account contributions between age 30 and 65, an additional 0.8% per annum amounts to about $55,000 in today’s dollars at retirement. This in turn translates into an additional retirement income of about $50 per week assuming a life expectancy of 85 years.
- The 10 largest non-profit funds had an average allocation of 20% to unlisted assets (private equity, unlisted property and infrastructure), compared with an average allocation of about 13% across all funds in our Growth universe;
- They used passive management selectively, for 15% of assets on average, and not just to reduce fees. Most often, passive management was used either to free up some of their ‘risk budget’ for more attractive opportunities or because of capacity restraints that would limit the potential added value of active managers;
- Their average investment fees were 0.66%, compared with 0.62% for all non-profit funds, 0.55% for actively-managed retail funds and 0.36% for the passive benchmark portfolio.
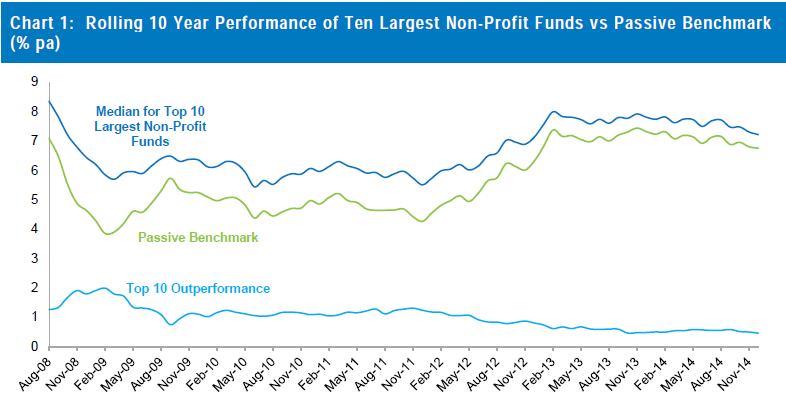
Source: Chant West
Clearly, higher fees and higher returns can go together.
On the subject of fee levels, it has been stated recently by the Grattan Institute and the Financial System (or Murray) Inquiry, among others, that because most fund members are disengaged, the super system lacks strong price-based competition resulting in fees being higher than they should be. We disagree, and we believe the preoccupation with fees will end up being detrimental to members. Of course fees could always be lower, and operational efficiencies flowing from SuperStream are likely to lead to reductions in the years ahead. But the scale of the major funds, coupled with the fiercely competitive nature of the funds themselves and their investment managers, means that even disengaged members already pay very reasonable wholesale fees to have their savings expertly managed.
2014 was a 'normal' year, but still a healthy one
After a year of ups and downs, the final results for 2014 marked a ‘return to normal’. The median growth fund returned a healthy 8.5%, about 6.8% above inflation. The range of returns in the growth category was 6.5% to 12.7%, meaning that even the worst-performed fund managed to do better than the typical target return of CPI + 3.5%.
Unlike 2013, Australian shares did not contribute a great deal to the overall performance, with the local market gaining just 5.3%. International shares did better, returning 10% on a fully hedged basis. Currency management was important, however, as it was in 2013, because unhedged international shares delivered a 15% return as a result of the falling A$.
The stand-out investments in 2014 were listed property securities. Australian REITs returned 26.8%, and even that was topped by global REITs which produced 29.4%. Global listed infrastructure also had an excellent year, up 21.4%.
Among the defensive asset sectors, falling interest rates saw Australian bonds up 9.8% and international bonds up 10.4%. The return from cash, where the official interest rate has been locked at historically low levels, was just 2.7%.
Chart 2 shows the median growth fund performance for each of the full 22 calendar years since the start of compulsory super in July 1992. The average annual return over that period now stands at 8.1%, against an average inflation rate of 2.6%. That 5.5% per annum real rate of return easily exceeds the typical performance target, which is to beat inflation by 3 to 4% (after investment fees and tax) over rolling 5 year periods.
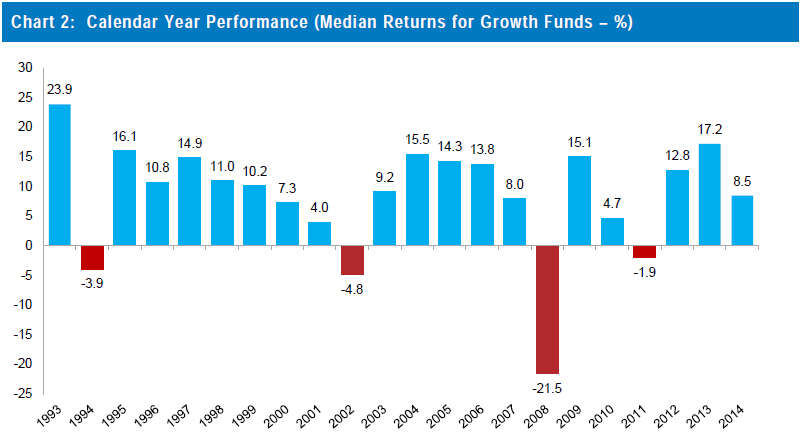
Source: Chant West
The chart also shows that there have been 4 negative years over the 22 year period, an average of less than one year in five. That is in line with the typical risk target for growth funds, so over an extended period these funds have delivered what they said they would.
Chart 3 compares the performance of the Growth category median with the typical return objective of CPI plus 3.5% per annum after investment fees and tax over rolling five year periods.
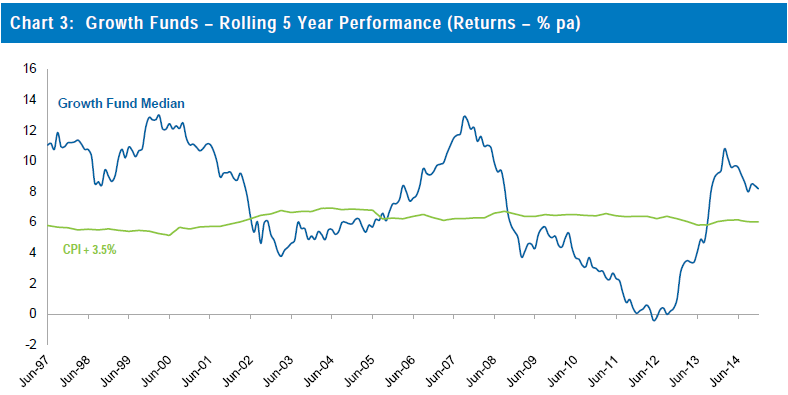
Source: Chant West
Note: The CPI figure for the December 2014 quarter is an estimate
Up until the GFC, the median fund outperformed the target most of the time, and often by a substantial margin. The GFC brought that to an abrupt halt, and led to the median fund dipping below the target line for several years. Now, with the GFC period having worked its way out of the calculation, we have seen the five year return rise sharply so that once again it is tracking well above that CPI plus 3.5% target. Overall, even taking account of the extraordinary severity of the GFC, funds have managed to keep their returns above the target line far more often than not.
Conservative funds (21 to 40% exposure to growth assets) suffered less during the GFC. They, too, dipped below their target return (CPI plus 2% per annum after fees and taxes over rolling three year periods) for a while, but resumed their outperformance more quickly. Chart 4 shows that these funds have been ahead of target most of the time over the past 22 year period.
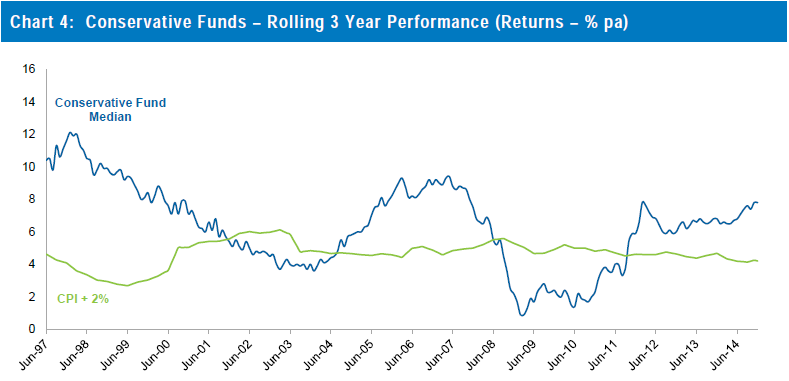
Source: Chant West
Industry funds edge retail funds
Industry funds edged out retails funds over the year, returning 8.7% versus 8.5%. Industry funds also hold the advantage over the longer term, having returned 6.9% per annum against 5.9% for retail funds over the 15 years to December 2014, as shown in Table 1.

Source: Chant West
Note: Performance is shown net of investment fees and tax. It does not include administration fees or adviser commissions
