Super funds were in the red over the March 2016 quarter with the median growth fund (61 to 80% allocation to growth assets) retreating 1.1%. That means the return over the nine months of the financial year to date is only marginally positive at 0.1%.
Australian shares were down 2.6% over the quarter. Hedged international shares fell 1.9%, but because of the sharp appreciation of the Australian dollar (up from US$0.73 to US$0.77) the return in unhedged terms was even lower at -5.8%. However, listed property had a positive quarter, with Australian REITs and global REITs up 6.4% and 3.3%, respectively.
Chant West director, Warren Chant says: "Although growth funds were down 1.1% over the quarter, things could have been much worse after share markets here and overseas sold off heavily over the first six weeks of 2016. There's been a strong rebound in markets since then, but the rise in the Australian dollar has meant that growth funds haven't benefited fully from this rally.
"Despite all the share market volatility we've seen for some time now, with the median growth return sitting at 0.1% for the first nine months of the financial year, we may end up with a seventh consecutive positive financial year.
"The lower return / higher volatility environment we're currently experiencing is likely to continue for some time given the shaky economic backdrop, and asset managers continue to report how challenging it is to identify future sources of growth. The downward pressure on investment fees presents another challenge as funds search for additional sources of return.
"In February, the US Federal Reserve Chair, Janet Yellen, warned that the financial market volatility posed a threat to US economic growth. This warning was reiterated in March when she said that the Fed needed to proceed cautiously in raising rates. While the US rate hike cycle seems to be on hold for now, the easing tendency is alive and well elsewhere with the European Central Bank cutting its rates again in March to an all-time low.
"Closer to home, there is continuing concern over the pace of growth of the Chinese economy. Meanwhile, back in Australia, GDP growth for the 2015 calendar year came in at a surprisingly healthy 3%. However, forecasts for 2016 are lower so a further rate cut by the RBA is still a live possibility."
Table 1 shows the median performance for each category in Chant West's multi-manager survey, ranging from All Growth to Conservative. Over three, five and seven years, all risk categories have met their typical long-term return objectives, which range from CPI + 2% for Conservative funds to CPI + 5% for All Growth. However, the GFC continues to weigh down longer-term returns. Over ten years the higher risk categories failed to achieve their objectives, but over 15 years the Growth, Balanced and Conservative funds did, while All Growth and High Growth fell slightly short having been hardest hit during the GFC.
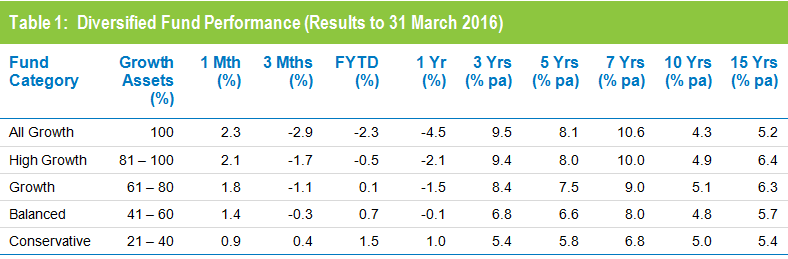
Source: Chant West
Notes: Performance is shown net of investment fees and tax. It is before administration fees and adviser commissions
Chart 1 compares the performance since July 1992 – the start of compulsory superannuation – of the Growth category median with the typical return objective for that category (CPI plus 3.5% per annum after investment fees and tax over rolling five year periods). The healthy returns in recent years, combined with the GFC period having worked its way out of the calculation, have seen the five year return continue to track well above that CPI plus 3.5% target.
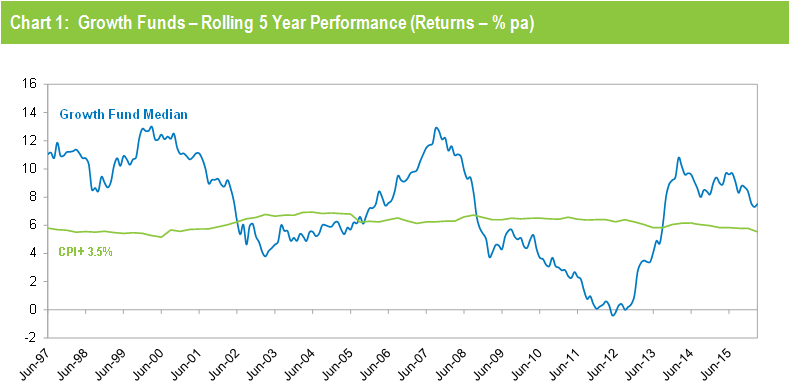
Source: Chant West
Note: The CPI figure for the March quarter is an estimate.
Chart 2 compares the performance of the lower risk Conservative category (21 to 40% growth assets) median with its typical objective of CPI plus 2% per annum over rolling three year periods. It shows that Conservative funds have also exceeded their objective in recent years.
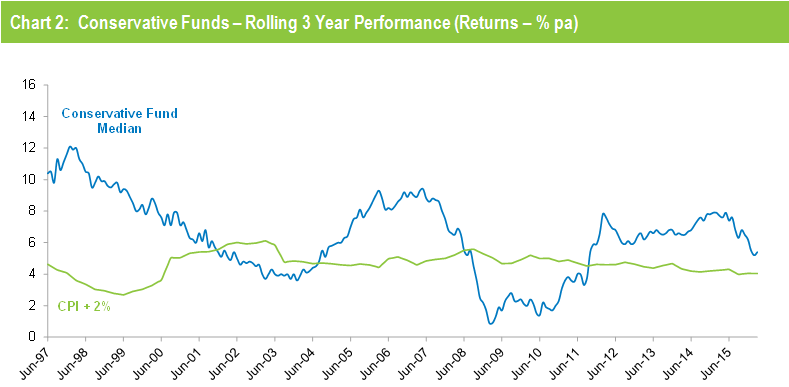
Source: Chant West
Note: The CPI figure for the March quarter is an estimate.
Industry funds ahead of retail funds over March quarter
Industry funds significantly outperformed retail funds over the March quarter, returning -0.6% versus -1.6%. Industry funds also hold the advantage over the longer term, having returned 6.7% per annum against 5.7% for retail funds over the 15 years to March 2016, as shown in Table 2.
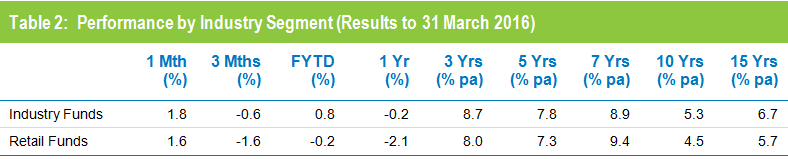
Source: Chant West
Note: Performance is shown net of investment fees and tax. It does not include administration fees or adviser commissions.
The industry funds' particularly strong outperformance over the year to March 2016 is mainly due to their higher allocations to unlisted assets such as unlisted infrastructure, unlisted property and private equity which have outperformed listed markets over the period. Australian and international share markets, which are down 9.3% and 4.4%, respectively, over the past year, are marked to market. However, unlisted assets are valued infrequently with their valuations typically lagging listed markets by six to nine months.
