Against most if not all expectations, 2017 turned out to be a stellar year for super funds. The median growth fund ended up 10.8% – the sixth consecutive positive annual return and well ahead of the funds' own performance targets. AustralianSuper took the top spot with 13.6%, and even the worst performing fund in our growth category delivered a respectable 7.6%. Growth funds have a 61 to 80% allocation to growth assets and are the ones in which most Australians are invested.
Chant West founder, Warren Chant says: "Growth funds have now delivered six straight positive calendar year returns, averaging over 10% a year. The last time we saw such a long sequence of positive returns was between 1995 and 2001. The 2017 return of 10.8% is the best result since 2013 when funds surged 17.2%. It is also more than 5% ahead of the typical long-term return objective for that category which is CPI + 3.5%. With inflation running at about 2%, that translates to a target of about 5.5%.
"Very few people would have predicted such an outstanding result 12 months ago. Back then, people were nervous about what Donald Trump's shock victory might lead to. And that was only months after Europe was thrown into turmoil by the surprise Brexit vote. However, despite all the uncertainty, share markets around the world took it in their stride as investors focused on the improving global economy. International shares surged 18.7% over the year in hedged terms and 13.4% unhedged, while Australian shares also had an excellent year, gaining 11.9%.
"Shares are still the main drivers of performance, but the major funds are well diversified across a wide range of other sectors including unlisted assets. The better performing funds in 2017 were those that had higher allocations to listed shares and to unlisted assets generally. A lower exposure to traditional bonds and cash also helped, given their mediocre returns."
Chart 1 shows the top 10 performing growth options over the year, which are all not-for-profit funds.

Notes:
1. The top 10 is limited to growth options with assets of $1 billion or more.
2. Performance is shown net of investment fees and tax. It is before administration fees and adviser commissions.
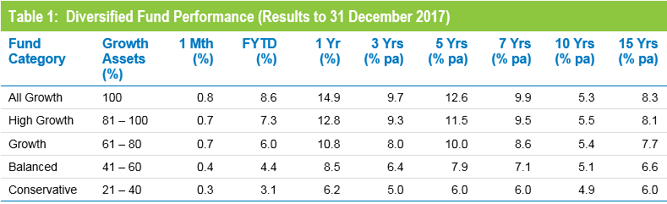
Table 1 compares the median performance for each fund category in Chant West's Multi-Manager Survey, ranging from All Growth to Conservative. Over one, three, five, seven and fifteen years, all risk categories have met their typical long-term return objectives, which range from CPI + 2% for Conservative funds to CPI + 5% for All Growth. However, the GFC continues to weigh down the ten year returns with only the Conservative and Balanced categories meeting their objectives over this period.
Source: Chant West
Note: Performance is shown net of investment fees and tax. It is before administration fees and adviser commissions
Funds still delivering on long-term targets
While 2017 was a vintage year, Chant encourages fund members to think long term. "By all means look at what your fund delivered last year, but what's really important is to know what its long-term objectives are and whether it's achieving them. Typically, you'll find that your fund is aiming to beat inflation by 3% to 4% a year over rolling five year periods. We now have data going back 25½ years to July 1992, the start of compulsory super. When we look back over that period, we find that the annualised return is 8.4% and the annual CPI increase is 2.5%, giving a real return above inflation of 5.9% per annum on average. So over the longest period we can measure funds have well and truly met their return objective.
"That's borne out visually in Chart 2, which compares the growth category median with the average return objective of CPI plus 3.5% per annum after investment fees and tax over rolling five year periods. Until 2009, the median fund outperformed the target most of the time. The GFC brought that to an abrupt halt, and the median dipped below the target line for several years. Now, with the GFC period out of the calculation, the five year return has been tracking well above the target line for the past four-and-half years."
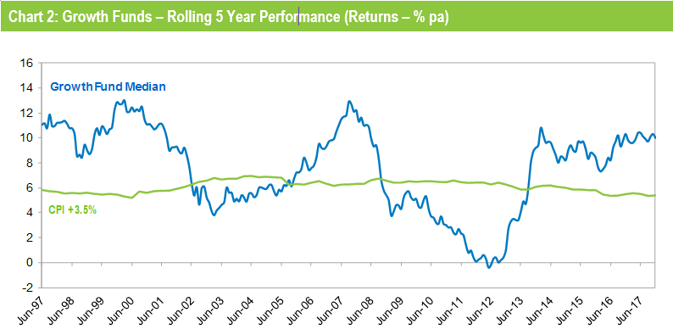
Note: The CPI figure for the December 2017 quarter is an estimate.
Returns are important but risk matters too
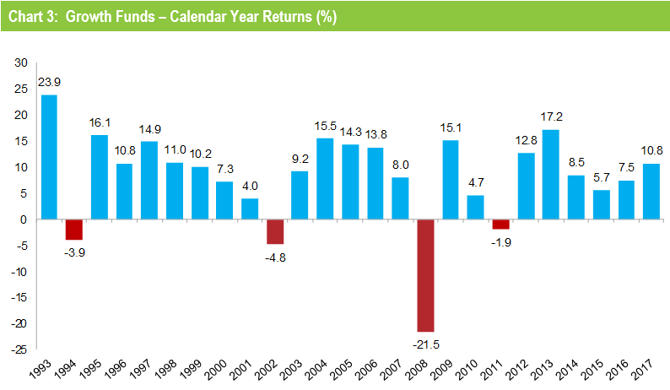
Chant says: "Returns are important but so is risk, and most funds also set themselves a risk objective. Risk is normally expressed as the chance of a negative return, and typically a growth fund would aim to post no more than one negative return in five years on average. Chart 3 plots the year by year performance of the median growth fund over the full 25 calendar years since the introduction of compulsory super. The objective would be no more than five negative years in that time, and in fact there have been only four so the risk objective has also been met."
"So over the longest period we can measure Australia's major super funds have delivered on their promises to members, growing their wealth in real terms while protecting them from undue risk."
Source: Chant West
Note: Performance is shown net of investment fees and tax. It is before administration fees and adviser commissions.
The investments that drove the performance
While there are differences between funds' investment strategies, even within the same risk category, most of their performance is driven by what happens in the major investment markets. For growth funds, that is primarily the Australian and international share markets, because those are the sectors where they allocate most of their money.
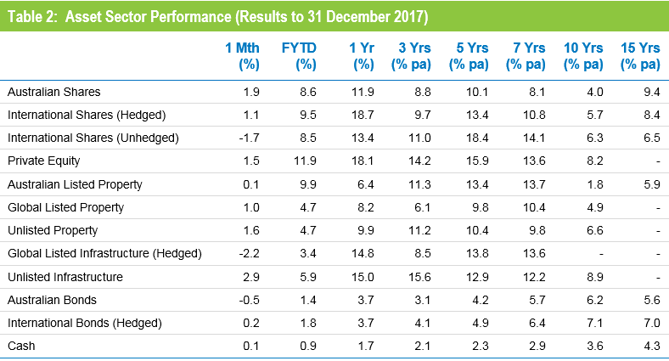
Table 2 shows the performance of all the main asset sectors over different time periods to the end of December 2017. We have used market indices for all sectors other than private equity and infrastructure. For those sectors, for which no indices exist, we have used the returns of a major fund in our survey that are representative of those markets.
Source: Chant West
The key points to note for the 2017 calendar year are:
- Hedged international shares were the strongest performing asset sector, surging 18.7%. However, the appreciation of the Australian dollar, which rose from US$0.72 to US$0.78 pulled this return back to 13.4% in unhedged terms.
- Australian shares performed strongly with a return of 11.9%.
- Listed property also delivered positive returns with Australian and global REITs up 6.4% and 8.2%, respectively. Unlisted property fared better with a return of 9.9%.
- Infrastructure also performed well, with global listed infrastructure up 14.8% and unlisted infrastructure delivering 15%. Private equity provided a particularly strong 18.1%.
- The traditional defensive asset sectors – bonds and cash – delivered the lowest returns but were still in positive territory. Australian and international bonds both rose 3.7% while cash was up 1.7%.
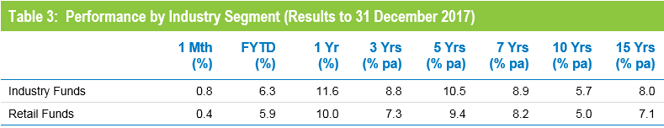
Industry funds ahead of retail funds over the year and longer term
Industry funds outperformed retail funds over the year, returning 11.6% versus 10%. Industry funds also hold the advantage over the medium and longer term, ahead by between 0.7% and 1.5% per annum, as shown in Table 3.
Source: Chant West
Note: Performance is shown net of investment fees and tax. It is before administration fees and adviser commissions.
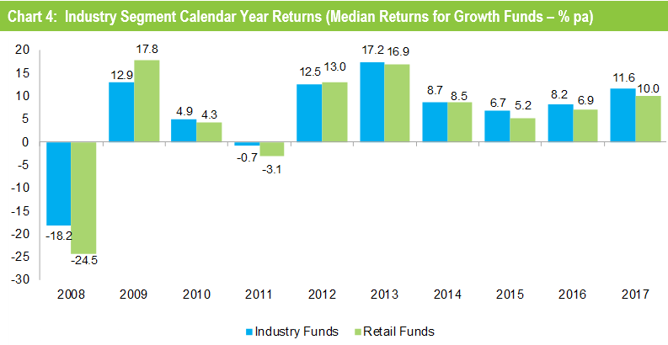
Chart 4 compares the performance of the two segments year by year over the past ten years.
Source: Chant West
Chant says: "Over the longer term industry funds, as a group, have outperformed retail funds largely because of the way they have allocated their investments and their preparedness to vary those allocations to suit changing market conditions.
"Specifically, they have always tended to have higher allocations to unlisted assets such as private equity, unlisted property and unlisted infrastructure (currently 21% versus 5%), which have performed well for them. Those allocations to unlisted assets have meant slightly higher investment costs, but those extra costs have been more than justified by the better performance and lower volatility.
"Historically, industry funds have also been more prepared to shift away from their longer-term target asset allocations to take advantage of mispricing or to preserve capital, and those medium-term shifts have had a positive effect on their performance."
Chart 5 shows the top 10 performing funds over ten years. As has been the case for many years, the list is dominated by industry funds which account for eight of the ten places. The other two places are occupied by QSuper, a non-profit fund formerly reserved for Queensland Government employees that has recently opened its doors to the public, and the stand-alone fund for employees of Telstra.
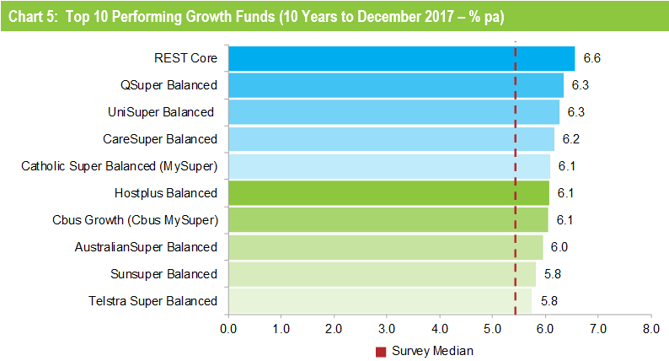
Notes:
1. The top 10 is limited to growth options with assets of $1 billion or more
2. Performance is shown net of investment fees and tax. It is before administration fees and adviser commissions.
