With less than two weeks of the financial year remaining, super funds look certain to deliver a ninth straight positive return for their members. The median growth superannuation fund (61 to 80% in growth assets) gained 0.4% in May, taking the return over the eleven months of the financial year to a healthy 8%.
Share markets – the main drivers of growth fund performance – were up over the month. Australian shares gained 1.2% while international shares advanced 1.3% in hedged terms, but the appreciation of the Australian dollar limited the return in unhedged terms to 0.4%. Listed property also advanced, with Australian and global REITs up 3% and 2.2%, respectively.
Chant West senior investment research manager, Mano Mohankumar says: “Markets are up so far in June, and with less than two weeks of the financial year remaining we estimate that the median return for growth funds is sitting at about 9.3%. So the better performing funds have a chance of finishing the year in double digit territory. Overall it’s shaping up as an excellent result when you consider that the typical long-term return objective for growth funds is to beat inflation by 3.5%, which in current terms translates to a return of 5.5% to 6%.
“This year’s return won’t reach the heights we’ve seen in some recent years, but it’s important to keep things in perspective. Growth funds have had a fantastic run averaging 9% per annum over the past eight financial years so even to be close to that level this year is impressive, especially as asset managers have been saying for some time that all asset classes are close to or fully valued and that it’s becoming increasingly difficult to find additional sources of return.
“The better performing funds this year have been those with higher allocations to listed shares and to unlisted assets generally. A lower exposure to traditional bonds and cash would also have helped greatly, because those have been by far the most disappointing sectors over the year.
“Looking at the activity in May, US shares made gains as new economic data was broadly positive and investors took the uncertainty about trade sanctions in their stride. Share markets in the euro zone retreated as a result of the political uncertainty in Italy, while the UK market had another good month.
“Closer to home, the Chinese share market also made gains as macroeconomic data remained firm. In Australia, the RBA again kept the official interest rate on hold at 1.5% where it has been since August 2016."
Table 1 compares the median performance for each category in Chant West’s Multi-Manager Survey, ranging from All Growth to Conservative. Over one, three, five, seven and fifteen years, all risk categories have met their typical long-term return objectives, which range from CPI + 2% for Conservative funds to CPI + 5% for All Growth. Even the 10 year returns, which have been weighed down longest by the GFC effect, have improved to the point where only the All Growth and High Growth categories are short of their objectives.
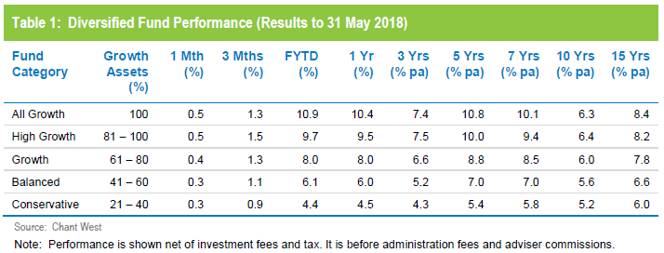
Chart 1 compares the performance since July 1992 – the start of compulsory superannuation – of the Growth category median with the typical return objective for that category (CPI plus 3.5% per annum after investment fees and tax over rolling five year periods). The healthy returns in recent years, and with the GFC period now out of the calculation, have seen the five year performance tracking well above that CPI plus 3.5% target.
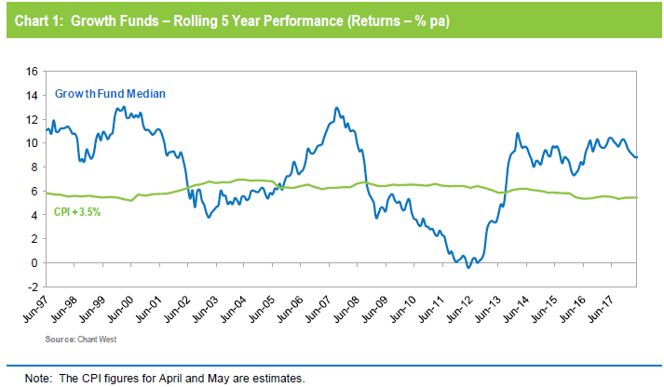
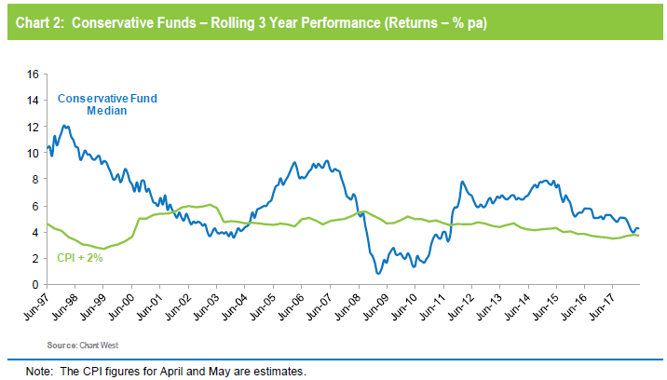
Chart 2 compares the performance of the lower risk Conservative category (21 to 40% growth assets) median with its typical objective of CPI plus 2% per annum over rolling three year periods. It shows that, now the GFC years have faded into history, Conservative funds have also been exceeding their performance objectives. The margin has fallen in recent months, however, due to the subdued returns from traditional bonds and cash.
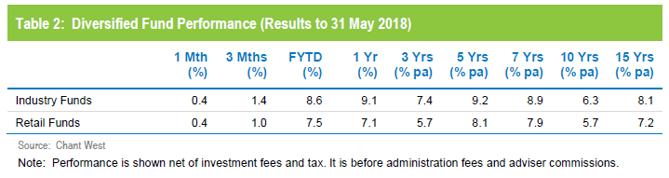
Industry funds still ahead for the year
Industry funds and retail funds performed in line with each other in May, returning 0.4% but industry funds remain well ahead over the financial year to date, at 8.6% versus 7.5%. Industry funds also continue to hold the advantage over the medium and longer term, ahead by between 0.6% and 1.7% per annum, as shown in Table 2.