Insurance through super is a valuable benefit, but also a significant cost to members. At a time when claims are escalating and premiums are rising, it’s more important than ever to know whether a fund's insurance represents good value. Now, thanks to ground-breaking analysis by Chant West, there's a simple way to do just that.
Insurance through super provides a level of financial protection that many members would not, or could not, provide for themselves. That’s a valuable benefit, but it comes at a cost to members and that cost is rising as a result of a blowout in claims. Faced with increasing premiums, members need to be confident that they are getting a reasonable deal from their fund, because every dollar they spend on insurance is a dollar that is not invested and growing their nest egg.
Over time, even a small difference in premiums can make a substantial difference to the size of someone’s eventual retirement benefit. For example, a 25 year old non-smoking female in a white collar job with $300,000 of Death and TPD cover would end up $15,000 better off (in today’s dollars) if her fund’s premiums were 30% lower than the industry average rather than 30% above it. And that sort of disparity is not unusual, as we demonstrate later.
Overcoming the challenges of comparing funds' premiums
Insurance premium comparison is difficult for two reasons – disclosure and complexity. Disclosure standards are poor, making it hard to compare funds on a fair, apples-with apples basis. Unlike fees, where disclosure has been tightened up, insurance has largely been ignored by the regulators. This is very disappointing, because insurance premiums can have a far greater impact than fees on the size of an individual’s eventual nest egg.
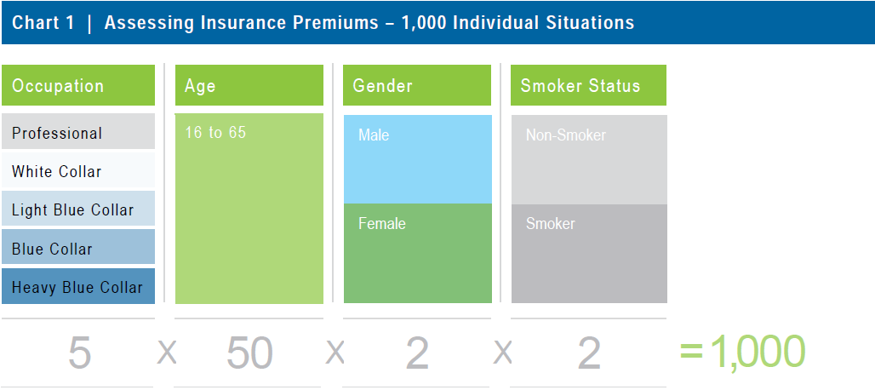
Insurance is also highly complex. As shown in Chart 1, a typical premium table will cover as many as 1,000 individual situations relating to the member's occupation, age, gender and smoker status.

Until now, short of comparing quotes from several funds or using a comparison tool such as Chant West AppleCheck, there has been nothing in the market to help individuals, or funds themselves, to gauge the market competitiveness of their premiums.
Chant West has pioneered a solution that overcomes these difficulties. In our 2014 Insurance Premium Survey, we capture the differences in premiums between funds, both overall and by member segments, and present them in the form of simple indices.
Without needing to know the underlying methodology, users just need to understand that an index figure of 1 means that the fund’s premiums are average. If a fund’s overall index was 0.90, we would say that its premiums were generally about 10% lower than average. Or if its index was 1.25, we would say that its premiums were generally about 25% more expensive than average.
Claims experience and premium increases prompting benefit design review
Apart from the comprehensive premium tables, the survey comments on current trends, including the effect of increasing claims on premium levels and benefit design.
In the past two years, the number of disability claims against industry funds has risen sharply – in some cases they have more than doubled. One of the reasons is that members are becoming increasingly aware of their ability to make claims. This has been partly due to the involvement of compensation law firms, which have advertised their ability to help members receive a disability payment from their fund, sometimes many years after the event.
This escalation of claims has resulted in premium increases of as much as 150% in some cases, which in turn has triggered a re-think of benefit design. We are starting to see a shift away from lump sum disability cover towards income replacement, and also a move away from a cost-based structure (i.e. the cover provided by $1 or $2 per week) to one based on the needs of the average member at each age.
Premium levels converging
While industry funds have grappled with premium increases, the other main segments of the industry have been less affected. In the case of public sector funds and corporate master trusts, this is partly because of their tighter eligibility requirements at the outset. Also, members of corporate master trusts have generally been more aware of their ability to claim, so there has not been such a sharp increase in claims volumes. There is also greater awareness in group retail, which is made up of group insurance policies in personal retail superannuation products, as these products are typically sold by advisers who can help their clients to claim.
In the employer-sponsored superannuation market, there has been a convergence in premium levels. While industry funds' premiums have been rising, master trusts' premiums have been falling following the removal of adviser commissions as required under MySuper. As a result, the premium differences between industry funds and commercial master trusts have all but disappeared.
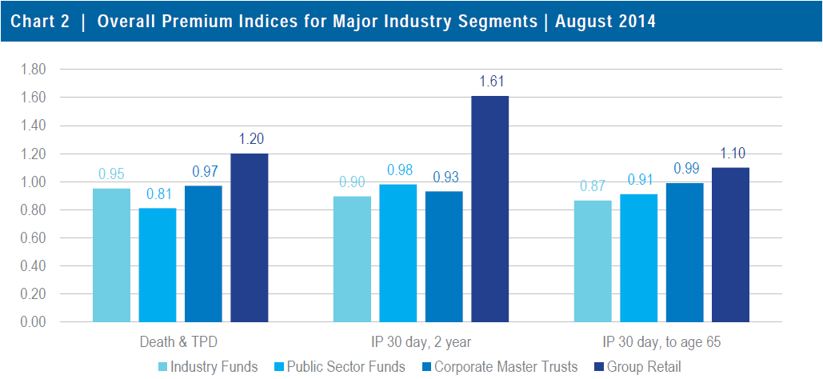
Chart 2 shows the median overall Death and TPD and Income Protection indices for the major industry segments (based on $300,000 Death and TPD cover and $60,000 pa Income Protection cover). The chart shows that public sector fund premiums are the lowest, partly due to the large numbers of white collar workers in these funds and the use of self-insurance in some cases. Industry fund premiums are marginally below those of corporate master trusts, while group retail premiums are the highest. This is due to the cost of underwriting every member and the fact that adviser commission still applies for members who joined before July 2014 in about half of these products. We have retained commission in premiums for group retail products that removed commission between 1 July 2013 and 1 July 2014, as most members will still be paying commission.

Substantial variation in premiums
The survey also highlights the substantial variation in premiums, with a wide range between the cheapest and most expensive at all ages.
Table 1 shows the range of premiums for 40 year old white and blue collar workers, based on $300,000 Death and TPD cover. On average, the premium for the bottom quartile (in terms of competitiveness) is about 80% higher than that for the top quartile.

Cross-subsidies abound in non-profit funds
Another observation from the survey is the degree of cross-subsidisation that occurs in the non-profit sector. This is largely because non-profit funds have attempted to simplify their insurance premiums, grouping members together rather than charging the 'true' premiums for different demographics.
This means that males generally get a better deal than females and older members get a better deal than younger ones.
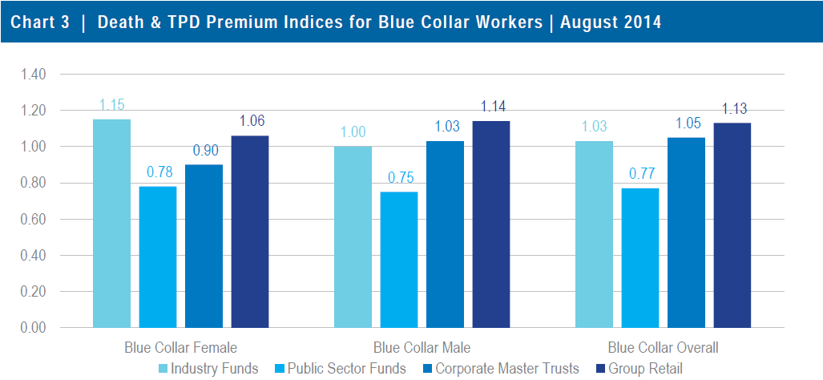
Chart 3, for example, shows the median indices for blue collar workers based on $300,000 of Death and TPD cover. While premiums in industry funds and public sector funds are typically the same for males and females, in group retail and some corporate master trusts, females are charged a lower premium that reflects their lower risk. This leads to higher female indices (when compared to males) for industry funds and public sector funds, and lower female indices for corporate master trusts and group retail.

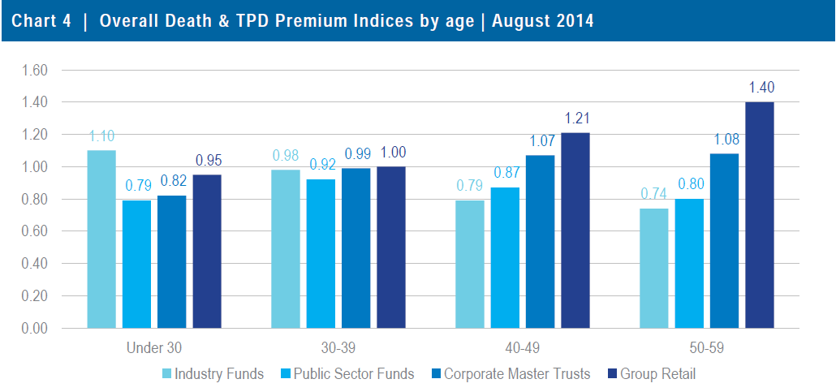
In similar fashion, younger members tend to subsidise older members. Chart 4 shows the overall death and TPD premium indices by age group. The industry fund cross-subsidy is illustrated by the decrease in industry fund indices as age increases, from 1.10 for members under age 30 to 0.74 for ages 50-59. This means older members are paying lower premiums than in other funds but younger members are paying more. The corollary is that the indices for corporate master trusts and group retail increase for those older age bands as their premiums better reflect the risks at older ages.

Poor disclosure of insurance premiums
As previously mentioned, insurance premiums are inconsistently disclosed, making it almost impossible for the average member to compare premiums on a fair basis. To ensure fair comparisons, we make adjustments to premiums to ensure that the premiums we quote are consistent with the following standards:
- Premiums are based on age next birthday
- Premiums include any commissions as they are seldom rebated
- Premiums are shown gross of income tax
- Premiums assume monthly payments
- Policy fees (where applicable) are included
- Stamp duty is included (our survey assumes residence in NSW)
- Large cover discounts (if any) are included
- Small cover loadings (if any) are included
- Our calculations also take into account the different premium scales that may apply for standard and additional cover


