Lifecycle products represent an important innovation in superannuation. They allow disengaged MySuper members to invest more like advised members, with an asset allocation that changes to suit their current stage in life. While there are flaws in some of the early models, these products will evolve and ultimately result in better member outcomes.
With the full introduction of MySuper in 2014, super funds that wanted to attract compulsory SG contributions had to decide what shape their MySuper offerings would take.
In the not-for-profit sector, most funds decided to use their existing default – typically what we categorise as their Growth option – as their MySuper offering. A few took a different direction and introduced a lifecycle option as their default. This involves a new member being assigned to a risk category appropriate for their age when they join, and then being switched to a lower risk option as they reach a given age.
In the retail sector, the great majority of funds also opted for a lifecycle approach (indeed, there are only three retail funds in our MySuper Growth category). The difference is that their lifecycle designs are based around age-based ‘cohorts’. These are typically defined by the decade in which the member was born, so the 1950s, 1960s, 1970s etc. Again, the member is assigned to a cohort when they join which has an appropriate investment allocation for their age. The difference is that they remain in that cohort throughout their membership. What changes over time is the asset allocation for that option. In other words, rather than switching from one investment option to another, they stay put but the asset allocation for their cohort is gradually de-risked.
The introduction of lifecycle products has added a new dimension to what drives member outcomes. For someone in a traditional default fund, the size of their eventual nest egg is determined by the contributions that go in and the fund’s capability to invest and grow those contributions.
With lifecycle products, however, there’s another factor – product design – that comes into play. By product design we mean how the fund changes the cohort’s exposure to growth assets over time – what’s called their ‘glide path’.
So how do the asset allocations for these lifecycle products change over time?
Table 1 shows the current median growth asset allocation for six age-based retail fund cohorts ranging from the 1940s (early baby boomers) to the 1990s (late millennials). It also compares these with the median for our MySuper Growth category. This category includes ‘traditional’ diversified MySuper options that have between 61 to 80% invested in growth assets which are either single option MySupers or part of a ‘switching-based’ lifecycle strategy.
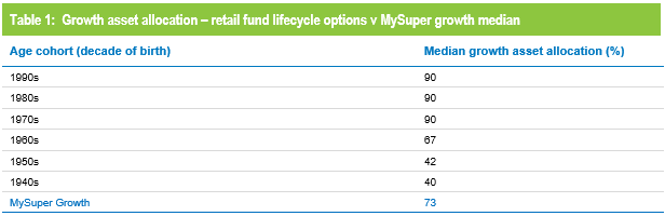
Looking at the age cohort allocations, it is clear that younger members take on considerably more market risk than the ‘one size fits all’ MySuper Growth option. Indeed, it is only those in the 1960s cohort and older (current age at least 48) who have a lower growth asset exposure than the typical MySuper Growth option.
In terms of our risk categories a 90% growth asset exposure represents High Growth. So a young member joining a lifecycle product at age 18 may well spend more time in the equivalent of High Growth than Growth during their working lifetime. To our mind that seems appropriate. Even at age 48 most people still have at least 12 years before they retire, and most will have money in the superannuation system long after that once they move into the pension phase.
Pursuing the Holy Grail of superannuation
In our opinion, lifecycle products are eminently suitable under MySuper. Whatever the design, they are all based on the premise that younger people can afford to take on relatively high levels of risk to give them the best opportunity to maximise growth while they are still a long way from retirement. As retirement approaches some de-risking is appropriate, and under the traditional model this requires a conscious decision to switch investment option. When we are talking about disengaged default members who are unlikely to make investment switching decisions for themselves, the fact that the lifecycle design does it for them makes great sense.
There are flaws in some of the existing lifecycle products and we touch on those below, but we believe that lifecycle represents an important step towards the ‘Holy Grail’ of superannuation which is for each member to have an asset allocation that is tailored to their personal circumstances. This may sound unachievable without the intervention of a financial adviser, but given funds’ ability to find out more about their members already, we believe it may be only a few years away.
Personalised asset allocation would be based on information the fund already has on a member supplemented by further information the member provides about their financial affairs outside superannuation – for example other superannuation accounts, home ownership, other financial assets and debts, spouse superannuation and retirement income expectations. Armed with this information the fund would be able to assess the likely timing of the member’s access to their superannuation and tailor their investment mix accordingly.
While this is the longer-term goal, a lifecycle product design represents an important step along the way. For this reason we believe that these products should not be discouraged.
Adding complexity to performance comparisons
Lifecycle products introduce some new variables that we, as researchers, need to take into account so that we can compare and rate them from an investment perspective. In the not-for-profit model the member transitions through a succession of investment options in different risk categories, so to capture their total experience we need to evaluate all those categories, not just the traditional default Growth option.
In the retail sector, with its cohort model, the de-risking takes place within the investment option rather than through shifts from one investment option to another. This makes it difficult to compare their investment performance directly with traditional diversified options. That is why we have a separate category in our surveys for these retail lifecycle options, and why we have started reporting on these products separately in our monthly performance media releases.
Complexity aside, it is interesting to look at the performance of the different cohort options of the retail lifecycle products. Table 2 does this, and includes the performance of the traditional MySuper Growth option for comparison purposes.
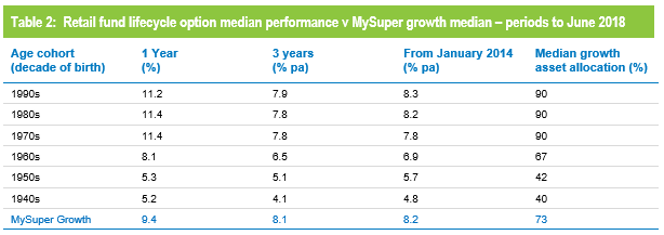
The past few years have seen strong performance from growth assets so, as you would expect, the options that have higher allocations to growth assets have done best. Younger members of retail lifecycle products – those born in the 1970s, 1980s and 1990s – have been holding their own compared with the median MySuper Growth fund over the first 4 ½ years of MySuper but have taken on more equity market risk. Strong returns are especially valuable at younger ages because they create a higher asset base from which growth can compound over the long period to retirement.
Older members – those born in the 1960s or earlier – have underperformed traditional MySuper Growth options by some margin. The lower return is because these older cohorts have taken on less risk.
This is because capital preservation becomes more important at those ages so, while they miss out on the full benefit of rising markets, older members in lifecycle strategies are better protected in the event of a market downturn.
It is worth noting that the Productivity Commission, in its draft submission on superannuation, called into question the use of retail lifecycle products in MySuper. The Productivity Commission’s analysis showed, not surprisingly, that the performance of lifecycle options in the years leading up to retirement was generally lower than for other MySupers. The reason is that these options for older members have a lower allocation to growth assets. However, the analysis did not seem to take into account that the lifecycle options have more growth assets in earlier years. It also seemed to discount the mitigation of sequencing risk by reducing exposure to risky assets around retirement.
It is true that the performance since inception (January 2014) of some retail lifecycle products has been a little disappointing, but this is partly due to the relatively low level of assets in these portfolios until the accrued default amounts were transferred in during the 12 months leading up to 1 July 2017. The smaller scale during these early years limited how these lifecycle MySuper products could be invested.
Fixing the flaws in the early lifecycle models
Personalised MySuper portfolios are still a few years off, and there is plenty of work to do in the meanwhile to refine the existing models and rectify some of their flaws. Happily this is becoming increasingly possible with the development of more powerful and flexible IT systems by funds and their administrators.
Looking first at the model favoured by the not-for-profit sector, where the member is switched from one risk category to the next as they reach a given age, we see this as a fairly blunt instrument. That is because members go through a succession of fairly abrupt changes in their asset allocation, which could be quite detrimental depending on the prevailing state of investment markets.
For example, a step down at age 50 from a Growth option to a Balanced option represents a reduction in growth assets from 70% to 50% on average. If that were to occur soon after a major market fall it would result in the member sustaining a substantial crystallised loss with not a lot of time before retirement to recoup that loss when the market recovers.
A different issue arises with the retail fund model with its ‘glide path’ design. If the age cohorts within the fund are in 10 year bands, as they typically are, two people born at different ends of the decade will have identical asset allocations. So someone born in June 1960 (now aged 58) will have the same growth exposure throughout their membership as someone born in June 1969 (now aged 49). Similarly two new members born only a few days apart, say late December 1999 and early January 2000 (both aged 18 now) will have very different allocations throughout their working lives once the de-risking process commences.
Both these models, therefore, introduce a new element of risk. For this reason, funds need to look for ways to soften the transition from one asset allocation to another. In the retail glide path design, for example, some funds adopt 5 year rather than 10 year age cohorts. This is a step towards the ideal which would be for people a similar age to have a similar glide path.
In the industry fund sector, too, funds have come up with more sophisticated approaches to adjusting their members’ risk exposure. For example, QSuper takes into account the member’s account balance as well as their age, with reviews and potential investment option switches occurring at 6 monthly intervals. Sunsuper uses a different method, which involves a small transfer every month after age 55. Money comes out of the default Balanced pool, with 90% going to the lower-risk Retirement pool and 10% to the Cash pool. The same applies to contributions, so by age 65 the member’s entire balance is split 90/10 between the Retirement and Cash pools.
Australian Catholic Super is another innovator with its LifetimeOne default strategy. This changes the member’s investment mix every year from age 40 to age 70, with the growth/defensive split gradually moving from 90/10 to 40/60. It entails moving the member through 31 different asset allocations in the process.
For profit or not, super funds have served their members well
With all the discussion about fees, fund design, the competing claims of the retail and not-for-profit sectors and the revelations from the Royal Commission, it is easy to lose sight of the big picture. The results, as we review the end of the 2018 financial year, are:
- The median growth superannuation fund has just delivered nine consecutive years of positive returns, averaging about 9% per annum
- Since the introduction of compulsory superannuation in 1992, the median fund has experienced only three negative years out of 26
- Over that entire 26 year period, the annualised return of 8.3% per annum has beaten the rate of inflation by 5.8% per annum on average, easily surpassing the typical return objective of CPI + 3.5% per annum
To illustrate the point, we reproduce below Chart 1, which we created as part of in our response to the Productivity Commission’s draft report on superannuation.
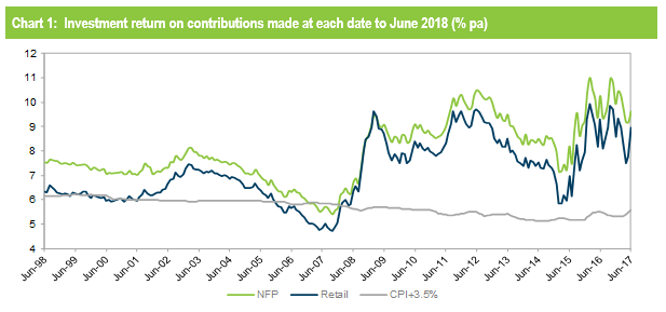
The chart shows the annualised return on a contribution made at the end of each month over the past 20 years, from the date of each contribution to June 2018. Not-for-profit and retail funds are plotted separately, and both are compared with the typical long-term return objective of CPI + 3.5% per annum.Once again it shows that members have, on average, been well served by their superannuation funds. While not-for-profit funds do hold the long-term advantage, both sectors have easily outperformed their objectives and added considerable value to their members’ superannuation savings.
