Super funds are poised to deliver a positive return for a ninth consecutive financial year. The only previous time we had a streak that long was from 1992/93 to 2000/01. With just two business days remaining, early estimates suggest that the median growth fund will post an impressive 9.2% for 2017/18, while some of the better-performing funds may deliver as much as 11.5%. Growth funds are those that have 61 to 80% of their investments in growth assets, and they are the ones in which the majority of Australian workers are invested.
Chant West senior investment research manager, Mano Mohankumar, says: “Growth funds will post another strong return for the 2018 financial year and extend their streak of positive years to nine, with some funds delivering double digit results. That’s a fantastic result, especially given that investment managers have been saying for some time that all asset classes are close to or fully valued and that it’s becoming increasingly difficult to find additional sources of return.
“Naturally, the financial year performance will get most of the attention but it’s always important to look at the latest returns in a longer-term context. Super fund members have enjoyed a fantastic run with 2008/09 being the last negative year that most of them experienced. Since the GFC low point back in February 2009, the median growth fund has delivered a cumulative return of over 130%, or an average of 9.5% per annum. That’s nearly 7.5% above the rate of inflation over the period, so it’s well ahead of the typical longer-term return objective which is to beat inflation by between 3% and 4% annually.
“As always, some funds have performed better than others. This year’s top funds may report returns as high as 11.5%, which is about 9.5% above the inflation rate. Even funds at the bottom end of the range are likely to achieve that performance objective with a return of about 6.5%. The better performing funds have been those with higher allocations to listed shares (particularly unhedged international shares) and to unlisted assets generally. A lower exposure to traditional bonds and cash would also have helped greatly, because those have been the most disappointing sectors.
“Looking at the two major industry segments, we expect industry funds to finish the year ahead of retail funds by about 1%, and that’s mainly due to their different approach to defensive assets. Growth funds have between 20% and 40% of their money in defensive investments. For retail funds that’s mainly in cash and bonds, which are going through a period of low returns. Industry funds, in contrast, have a meaningful amount of their defensive exposure invested in unlisted assets such as core unlisted property and infrastructure, which have performed well for them. Choosing the unlisted route has worked well because the global listed property and infrastructure markets have delivered lower returns.”
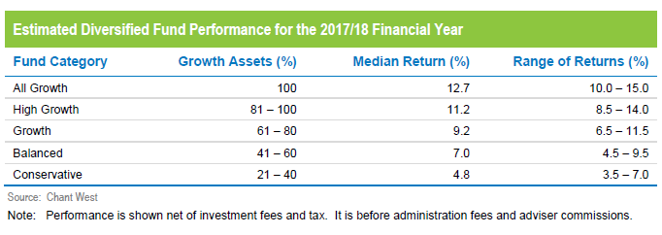
The table below shows the estimated median performance and ranges for each category in Chant West’s Multi-Manager Survey, ranging from All Growth to Conservative.
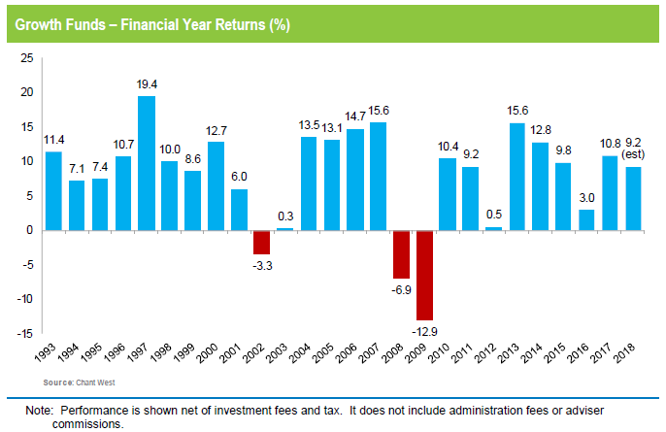
The chart below shows the median growth fund performance for each financial year since the start of compulsory super in July 1992. Of those 26 years, 23 were positive and 3 were negative, 2 of those being 2007/08 and 2008/09 in the depths of the GFC.
The keys to strong performance in FY18
Mohankumar says: “The typical growth fund has on average 53% allocated to listed Australian and international shares (excluding REITs), so the performance of those sectors has the greatest influence on overall returns. With only two days remaining, Australian shares are up a very healthy 13% over the financial year. International shares have also performed strongly, with a return of 10.2% in hedged terms and 14.8% unhedged. So it would certainly have helped your performance to have a sizeable exposure to listed share markets.
“Listed property has also had a positive year with both Australian and global REITs up.
“Unlisted assets had another good year. They aren’t valued regularly, so it will be a little while before we can see exactly how well they have performed. But we expect returns for unlisted property to be between 8% and 12% once the June quarter revaluations are factored in. Returns from unlisted infrastructure will be a little higher and may hit the low teens, while private equity returns are likely to be in the low to high teens.
“As mentioned earlier, the traditional defensive assets of bonds and cash have been the worst performing sectors over the past year. Australian and global bonds returned just 3% and 1.6%, respectively, while cash returned just 1.8%.”
