Super funds are closing in on a ‘better than expected’ result for the 2020 calendar year. Share markets surged in November, powering the median growth fund (61 to 80% in growth assets) to a return of 4.9% for the month. That drove the cumulative return for the first eleven months of the year to 2.6%. Markets are up slightly in December so far and we estimate that, with two weeks to go, the calendar year return is now sitting at about 3%. A final result in the black, even a small one, would represent an excellent outcome for fund members given the disruption and economic damage caused by COVID-19. And let’s not forget that only a year ago members were enjoying one of the strongest years in the past 20, with growth funds returning 14.7% for calendar 2019.
Chant West senior investment research manager Mano Mohankumar says: “If we look back to the end of March, the world was in chaos. We were facing a frightening health crisis which saw most countries introduce some form of lockdown. Whole industries ground to a halt, countless jobs were lost and the global economy was heading rapidly into recession. Super returns suffered, with the median growth fund plummeting 12% over February and March. However, since then we’ve seen a surprisingly sharp share market recovery that has propelled growth funds to a remarkable 14.7% turnaround (to mid-December).
“November’s surge in global share markets was driven mainly by reports of vaccine breakthroughs which gave investors a sense of light at the end of the tunnel and provided optimism around a return to some economic normality. Indeed, it was the more economically-sensitive sectors, including energy and financials, that experienced the biggest gains over the month. Additionally, Joe Biden’s US election victory removed much of the uncertainty that had been weighing on markets. In the Eurozone, infection rates fell in many countries resulting in the easing of restrictions.
“Back at home, all states now have COVID numbers under control – although occasional outbreaks must still be expected. In early November, the RBA announced a package of measures to support job creation and the post-COVID economic recovery. This included lowering the official cash rate to a new all-time low of 0.1% and a quantitative easing program which will see the bank purchase $100 billion of government bonds over the next six months.
“This year’s experience highlights to super fund members the importance of maintaining a long-term focus. Those who panicked and switched to cash or a more conservative option back in March would not only have crystalised losses, but as markets rebounded so sharply they would have missed out on some or all of the rebound.”
Table 1 compares the median performance for each of the traditional diversified risk categories in Chant West’s Multi-Manager Survey, ranging from All Growth to Conservative. Over 3, 5, 7, 10 and 15 years, all risk categories have met their typical long-term return objectives, which range from CPI + 2% for Conservative funds to CPI + 4.25% for All Growth.
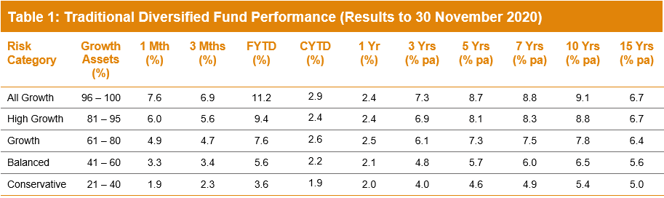
Note: Performance is shown net of investment fees and tax. It is before administration fees and adviser commissions.
Source: Chant West
Lifecycle products behaving as expected
Mohankumar says: “While our Growth category is still where most people have their super invested, a meaningful number are now in so-called ‘lifecycle’ products. Most retail funds have adopted a lifecycle design for their MySuper defaults, where members are allocated to an age-based option that is progressively de-risked as that cohort gets older.”
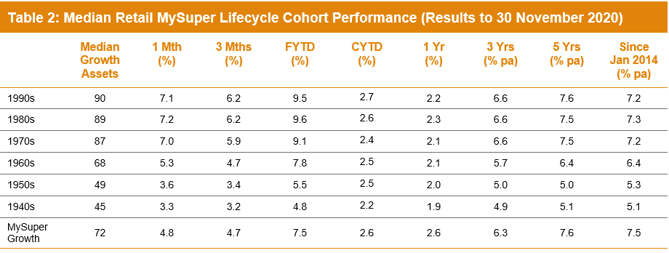
It’s difficult to make direct comparisons of the performance of these age-based options with the traditional options that are based on a single risk category, and for that reason we report them separately. Table 2 shows the median performance for each of the retail age cohorts, together with their current median allocation to growth assets. It also includes a row for traditional MySuper Growth options for comparison – nearly all of which are not-for-profit funds. Care should be taken when comparing the performance of the retail lifecycle cohorts with the median MySuper Growth option, however, as they are managed differently so their level of risk varies over time.
Notes:
1. Performance is shown net of investment fees and tax. It is before administration fees and adviser commissions.
2. January 2014 represents the introduction of MySuper.
Source: Chant West
As a result of the strong recovery since April, the options that have higher allocations to growth assets have now generally done better over all periods shown. Younger members of retail lifecycle products – those born in the 1970s, 1980s and 1990s – have outperformed the MySuper Growth median over the short term and have held their own over the medium to longer terms. However, they have done so by taking on more share market risk.
The older cohorts (those born in the 1950s or earlier) are relatively less exposed to growth assets so you would expect them to underperform the MySuper Growth median over longer periods. Capital preservation is more important at those ages so, while they miss out on the full benefit in rising markets, older members in retail lifecycle options are better protected in the event of a market downturn.
Long-term performance remains above target
MySuper products have only been operating for less than seven years, so when considering performance, it is important to remember that super is a much longer-term proposition. Since the introduction of compulsory super in 1992, the median growth fund has returned 8.1% per annum. The annual CPI increase over the same period is 2.4%, giving a real return of 5.7% per annum – well above the typical 3.5% target. Even looking at the past 20 years, which now includes three share major market downturns – the ‘tech wreck’ in 2001–2003, the GFC in 2007–2009 and now COVID-19 – the median growth fund has returned 6.6% per annum, which is still well ahead of the typical return objective.
The chart below shows that, for the majority of the time, the median growth fund has exceeded its return objective over rolling ten-year periods, which is a commonly-used timeframe consistent with the long-term focus of super. The exceptions are two periods between mid-2008 and late-2017, when it fell behind. This is because of the devastating impact of the 16-month GFC period (end-October 2007 to end-February 2009) during which growth funds lost about 26% on average.
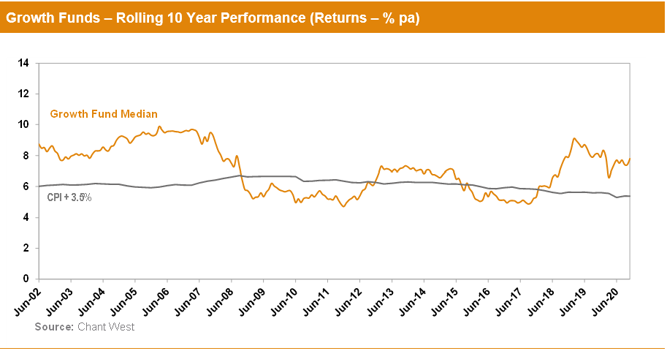
Note: The CPI figure for October and November 2020 are estimates.
International share market returns in this media release are sourced from MSCI. This data is the property of MSCI. No use or distribution without written consent. Data provided “as is” without any warranties. MSCI assumes no liability for or in connection with the data. Product is not sponsored, endorsed, sold or promoted by MSCI. Please see complete MSCI disclaimer.
