Super funds retreated further in May, with the median growth fund (61 to 80% in growth assets) recording a 1% decline for the month. While the falls in April and May were minor setbacks, things have worsened significantly since then. Share and bond markets have taken such a beating in the first half of June that, with less than two weeks of the year remaining, we estimate that the median growth fund return is now sitting at about -5% over FY22 to date. However, given the magnitude of recent market fluctuations, the final result could be materially different – either for the worse or the better.
Chant West Senior Investment Research Manager, Mano Mohankumar, says while it’s now almost certain that growth funds will finish the financial year in the red, members should resist hitting the panic button. “People need to see things in context. A negative result would be only the fifth in 30 years since the introduction of compulsory super in 1992. And remember that this year’s result comes on the back of the outstanding 18% return in FY21, the second best in the history of compulsory super. And even in the 2020 financial year, which included the COVID-induced share market meltdown, the loss was limited to just 0.6% on average. Quite a few funds actually delivered positive returns that year, so for many members a negative result this year would be their first in 13 years.
“Fund members can also take comfort in the fact that, even after factoring in the large losses in June to date, the median growth fund is still 5% ahead of the pre-COVID high at the end of January 2020. More importantly, funds are continuing to meet their long-term return objectives with a comfortable margin to spare.
“When markets fall sharply, as they’ve done recently, there’s a tendency for some people to panic and think about moving money into less risky investment options, or to cash, with a view to switching back later. But attempting to time markets is a risky proposition. Far more often than not, it results in a worse outcome in the long run than if you sit tight and stay the course. Panicking only converts paper losses into real ones. Not only that, you risk missing out when markets rebound – as they will at some point. Even many members close to retirement can afford to take a long-term view. That’s because a lot of people most likely won’t take out all their super when they retire. A substantial amount is likely to stay in the super system in the pension phase, often for many years, which provides plenty of time for losses to be recovered.
“So we encourage everyone – younger and older – to remember that superannuation is indeed a long-term investment. Most members can afford to remain patient and, if you’re thinking about withdrawing money or switching to a less risky option, we strongly encourage you to seek financial advice before doing so.”
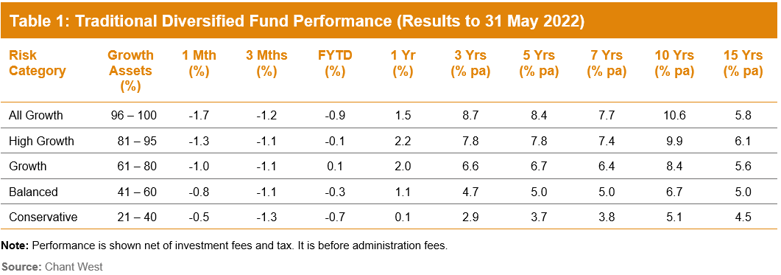
Table 1 compares the median performance to the end of May 2022 for each of the traditional diversified risk categories in Chant West’s Multi-Manager Survey, ranging from All Growth to Conservative. All risk categories have generally met their typical long-term return objectives, which range from CPI + 1.75% for Conservative funds to CPI + 4.25% for All Growth.
Lifecycle products behaving as expected
Mohankumar says that while the Growth category is still where most people have their super invested, a meaningful number are now in so-called ‘lifecycle’ products. “Most retail funds have adopted a lifecycle design for their MySuper defaults where members are allocated to an age-based option that’s progressively de-risked as that cohort gets older,” he said.
“It’s difficult to make direct comparisons of the performance of these age-based options with the traditional options that are based on a single risk category, and for that reason we report them separately. Table 2 shows the median performance for each of the retail age cohorts, together with their current median allocation to growth assets. For comparison purposes it also includes a row for traditional MySuper Growth options – nearly all of which are not-for-profit funds. Care should be taken when comparing the performance of the retail lifecycle cohorts with the median MySuper Growth option, however, as they’re managed differently so their level of risk varies over time.”
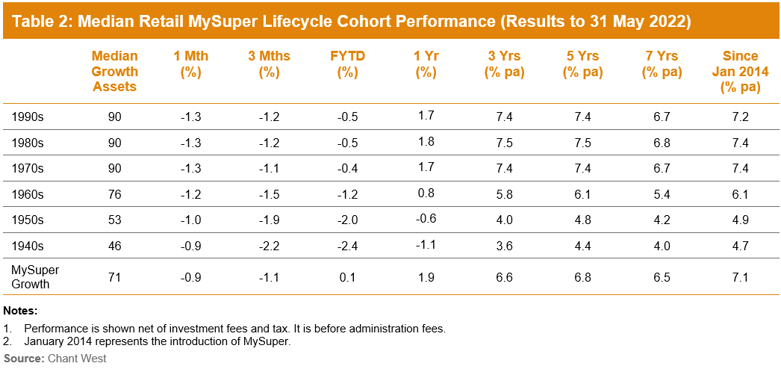
Despite the falls in global share markets so far in 2022, options that have higher allocations to growth assets have done better over most periods shown. Younger members of retail lifecycle products – those born in the 1970s, 1980s and 1990s – have generally either outperformed or performed in line with the MySuper Growth median over the three-year period and longer. However, they’ve done so by taking on significantly more share market risk. On average, these younger cohorts have at least 20% more invested in listed shares and listed real assets than the typical MySuper Growth option.
The 1960s cohort has generally underperformed the median MySuper Growth option. This is partly due to a lower allocation to growth assets up until recently, when lifecycle product providers revised their glide paths to delay the de-risking process until older ages. Another reason for this underperformance is a lower allocation to unlisted assets, which have performed well, and a higher allocation to traditional defensive asset sectors, such as bonds and cash, which have been the weakest performing sectors since the introduction of MySuper.
The oldest cohorts (those born in the 1950s or earlier) are relatively less exposed to growth assets so you would expect them to underperform the MySuper Growth median over longer periods. Capital preservation is more important at those ages, so while they miss out on the full benefit in rising markets, older members in retail lifecycle options are generally better protected in the event of market weakness.
Long-term performance remains above target
MySuper products have only been operating for eight years, so when considering performance it’s important to remember that super is a much longer-term proposition. Since the introduction of compulsory super in 1992, the median growth fund has returned 8% p.a. The annual CPI increase over the same period is 2.5%, giving a real return of 5.5% p.a. – well above the typical 3.5% target. Even looking at the past 20 years, which now includes three major share market downturns – the ‘tech wreck’ in 2002–2003, the GFC in 2007–2009 and COVID-19 in 2020 – the median growth fund has returned 7% p.a., which is still well ahead of the typical return objective.
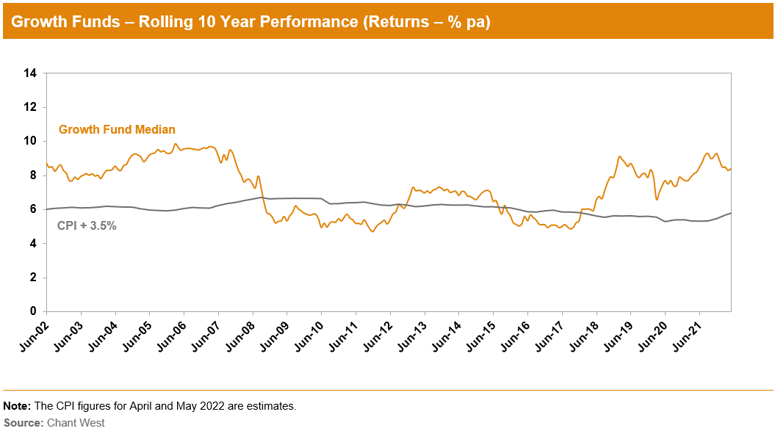
The chart below shows that, for the majority of the time, the median growth fund has exceeded its return objective over rolling 10-year periods, which is a commonly used timeframe consistent with the long-term focus of super. The exceptions are two periods between mid-2008 and late-2017, when it fell behind. This is because of the devastating impact of the 16-month GFC period (end-October 2007 to end-February 2009) during which growth funds lost about 26% on average.
International share market returns in this media release are sourced from MSCI. This data is the property of MSCI. No use or distribution without written consent. Data provided “as is” without any warranties. MSCI assumes no liability for or in connection with the data. Product is not sponsored, endorsed, sold or promoted by MSCI. Please see complete MSCI disclaimer.
