After experiencing sharp losses in early February on the back of sliding share markets, the median growth superannuation fund (61 to 80% in growth assets) recovered to finish the month barely in the red, down just 0.2%. Despite the slight setback, the return over the first eight months of the financial year remains at a healthy 6.5%.
In February, share markets around the world retreated as investors became concerned about the prospect of rising inflation and interest rates. Hedged international shares lost 3.6%, but a lower Australian dollar (down from US$0.81 to US$0.78) limited the fall to 0.4% in unhedged terms. Growth funds currently have on average about 70% of their international shares exposure unhedged so they benefitted greatly from currency movements in February. Australian shares did better, with a positive return of 0.3%. Listed property was down, with Australian and global REITs falling 3.2% and 6.3%, respectively.
Chant West senior investment research manager, Mano Mohankumar says: "In February we saw volatility return to listed share markets. These markets are important drivers of super fund performance, but they're by no means the only drivers. Members sometimes panic when they hear about share markets falling sharply, but they need to remember that the typical growth fund only has about 55% of its assets in listed shares and property. These funds invest in a wide range of other assets as well, including alternative and unlisted assets, so when share markets stumble this diversification enables them to cushion the blow – as happened in February.
"Higher than expected wage inflation in the US is what caused concerns that the Federal Reserve might increase the pace of interest rate hikes, and as a result sent investment markets into turmoil in early February. However, resilient macroeconomic data helped calm investors' nerves, and markets erased some of the losses as the month progressed.
"Closer to home, the Chinese share market also lost ground but again the bigger economic picture remains relatively stable. In Australia, with inflation remaining below the RBA's benchmark of 2%, the central bank kept interest rates on hold at 1.5% for the 17th consecutive time."
Table 1 compares the median performance for each category in Chant West's Multi-Manager Survey, ranging from All Growth to Conservative. Over one, three, five, seven and fifteen years, all risk categories have met their typical long-term return objectives, which range from CPI + 2% for Conservative funds to CPI + 5% for All Growth. Even the ten year returns, which have been weighed down longest by the GFC effect, have improved to the point where only the All Growth and High Growth categories are short of their return objectives.
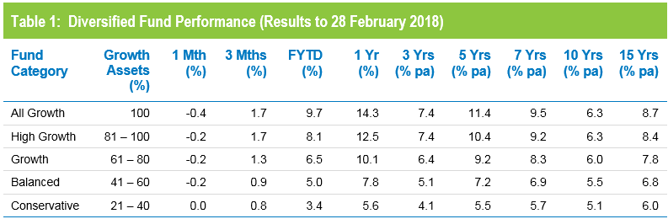
Source: Chant West
Note: Performance is shown net of investment fees and tax. It is before administration fees and adviser commissions.
Chart 1 compares the performance since July 1992 – the start of compulsory superannuation – of the Growth category median with the typical return objective for that category (CPI plus 3.5% per annum after investment fees and tax over rolling five year periods). The healthy returns in recent years, and with the GFC period now out of the calculation, have seen the five year performance tracking well above that CPI plus 3.5% target.
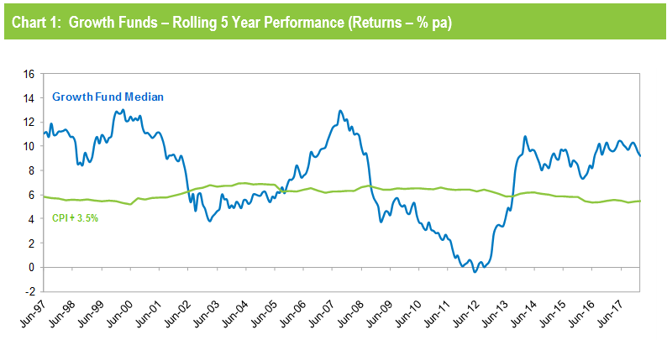
Source: Chant West
Note: The CPI figures for January and February 2018 are estimates.
Chart 2 compares the performance of the lower risk Conservative category (21 to 40% growth assets) median with its typical objective of CPI plus 2% per annum over rolling three year periods. It shows that, now the GFC years have faded into history, Conservative funds have also been exceeding their performance objectives.
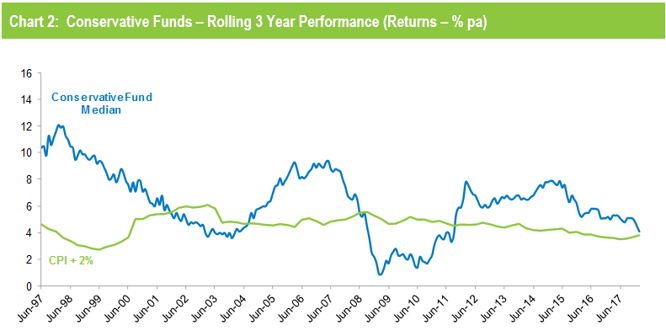
Source: Chant West
Note: The CPI figures for January and February 2018 are estimates.
Industry funds led retail funds in February
Industry funds outperformed retail funds in February, returning -0.1% versus -0.3%, and remain ahead over the financial year to date, at 6.9% versus 6.3%. Industry funds continue to hold the advantage over the medium and longer term as well, ahead by between 0.5% and 1.6% per annum, as shown in Table 2.
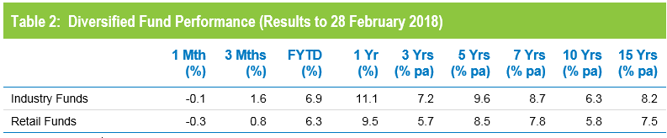
Source: Chant West
Note: Performance is shown net of investment fees and tax. It is before administration fees and adviser commissions.
