After a disappointing end to 2018, super funds bounced back over the March quarter with the median growth fund (61 to 80% in growth assets) gaining 6%. This brought the return over the first nine months of the 2018/19 financial year back into the black at 3.3%.
The resurgence came on the back of a strong rebound in local and international share markets. Australian shares were up 10.9% over the quarter. International shares were even stronger with a return of 12.7% in hedged terms. The small appreciation of the Australian dollar (up from US$0.70 to US$0.71) meant that the gain on an unhedged basis was slightly lower at 11.5%. Listed property was the star performer, with Australian and international REITs advancing 14.4% and 14.5%, respectively.
Chant West senior investment research manager Mano Mohankumar says: "The 6% rise for growth funds over the March quarter more than offset the 4.6% loss over the December 2018 quarter. With the financial year return sitting at 3.3% and share markets up in April so far, super funds are back on track for a 10th consecutive positive financial year result.
"The V-shaped pattern experienced by share markets over the past six months provides a valuable lesson for fund members. The worst thing you could do after the December quarter falls would have been to switch into cash or a conservative option with a lower exposure to shares. Not only would you have locked in the losses, but you would also have missed out on the March quarter rebound. As always, the message is to choose an appropriate option and stick with it.
"The share market rebound was driven partly by optimism that there may be a successful resolution to the US-China trade dispute. Markets were also buoyed by the US Federal Reserve highlighting greater flexibility in future interest rate decisions. In the UK, meanwhile, the Brexit saga continues, with the UK granted a delay to try to negotiate an orderly exit.
"While the March quarter was strong, we would caution members not to get carried away. There are still concerns about US trade tensions, not only with China but more recently with Europe. With that, the Brexit confusion and the slowing pace of global economic growth, there are no easy pickings for asset managers."
Table 1 compares the median performance for each of the traditional diversified risk categories in Chant West’s Multi-Manager Survey, ranging from All Growth to Conservative. All risk categories are now ahead of their long-term return objectives over 1, 3, 5, 7, 10 and 15 years.
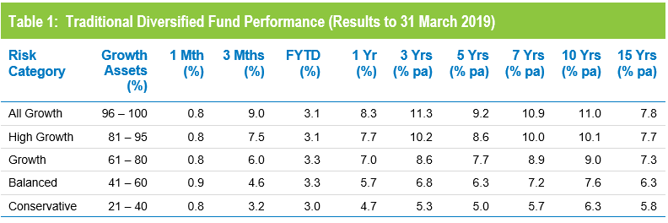
Source: Chant West
Note: Performance is shown net of investment fees and tax. It is before administration fees and adviser commissions.
Lifecycle products behaving as expected
Mohankumar says, "While our Growth category is still where most people have their super, a meaningful number are now in so-called ‘lifecycle’ products. Most retail funds have adopted a lifecycle design for their MySuper defaults, where members are allocated to an age-based option that is progressively de-risked as that cohort gets older.
"It's difficult to make direct comparisons of the performance of these age-based options with the traditional options that are based on a single risk category, and for that reason we report them separately. Table 2 shows the median performance for each of the retail age cohorts, together with their current median allocation to growth assets."
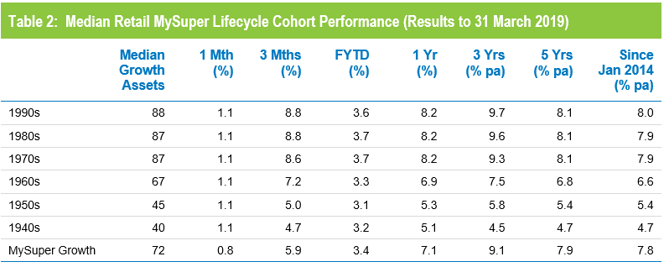
Source: Chant West
Note: Performance is shown net of investment fees and tax. It is before administration fees and adviser commissions.
While lifecycle is the most common MySuper default in the retail sector, most not-for-profit funds still use their traditional growth options for that default role. A few have gone down the lifecycle path, however, and while the general premise is the same the way it is implemented is different. Rather than allocating members to age-based cohorts as retail funds do, in the not-for-profit lifecycle model members typically 'switch' from one traditional risk category to another at particular ages. The diversified options that underlie these strategies are included in Table 1.
To help illustrate the early results of the retail lifecycle model, Table 2 includes a row for traditional MySuper Growth options – mainly, but not all, not-for-profit funds. Care should be taken when comparing the performance of the retail lifecycle cohorts with the median MySuper Growth option, however, as they are managed differently so their level of risk varies over time.
Aside from calendar 2018, we have seen strong returns from growth assets in recent years so, as you would expect, the options that have higher allocations to those growth assets have generally done best. Younger members of retail lifecycle products – those born in the 1970s, 1980s and 1990s – have generally outperformed the median MySuper Growth fund, but have done so by taking on more share market risk.
The older age cohorts (those born in the 1960s or earlier) are less exposed to share market risk. Capital preservation is more important at those ages so, while they miss out on the full benefit in rising markets, older members in retail lifecycle options should be better protected in the event of a market downturn. We saw that in evidence over the December 2018 quarter, but overall the older cohorts have underperformed the traditional MySuper Growth options by a significant margin.
Long-term performance remains above target
MySuper products have been operating for less than five years, so when considering performance it is important to remember that super is a much longer-term proposition. The Chart below compares the performance since July 1992 – the start of compulsory superannuation – of the traditional Growth category median with the typical return objective for that category (CPI plus 3.5% per annum after investment fees and tax over rolling five-year periods). Notwithstanding the sharp downturn at the end of 2018, the healthy returns in recent years have seen the longer-term performance tracking above that CPI plus 3.5% target for the past five years.
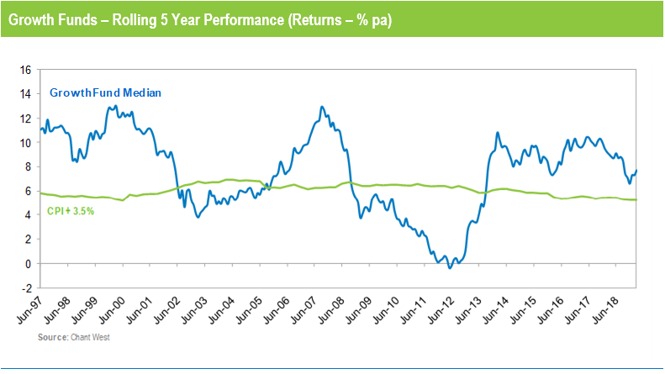
Source: Chant West
Note: The CPI figures for the March quarter is an estimate.
