After averaging 12.7% per annum over the three previous years, super funds delivered a fourth consecutive calendar return in 2015 with the median growth fund returning a more modest but respectable 5.8%. The top-performing fund for the year was MTAA, which returned 9.5%. Even the worst-performing fund in the growth category produced a positive return of 1.8% which is still slightly ahead of inflation for the year. Growth funds are those that have 61 to 80% of their investments in growth assets and are the ones in which the majority of Australians are invested.
Chant West director, Warren Chant says: "While the 2015 return of 5.8% is lower than the previous three years (12.8% in 2012, 17.2% in 2013 and 8.5% in 2014), members shouldn't be disappointed with the result. The typical longer-term return objective for these funds is to beat inflation by 3% to 4% per annum, and with the inflation figure likely to come in well under 2% for the year they've pretty much hit that target. We should also acknowledge that 2015 was a very difficult year for investors, especially given the uncertainty about China's prospects and what that means for the global economy. Under the circumstances, we regard 5.8% a respectable result.
"2015 provided another great example of the benefits of diversification. By that we mean the way funds spread their investments far beyond listed shares, property, bonds and cash and so avoid getting dragged down if those traditional sectors have a poor year. In 2015 Australian shares, hedged international shares, Australian and international bonds all produced fairly anaemic returns of 3.5% or lower, yet growth funds still managed to average 5.8%. They did that by including alternative, unlisted assets in their investment mix and by letting currency movements work to their advantage.
"The better performing funds were generally those that maintained a relatively high exposure to foreign currency (because of the decline in value of the Australian dollar), Australian listed property, unlisted property, unlisted infrastructure and private equity, and a lower exposure to Australian shares, hedged international shares, the broader bond market, hedge funds and cash."
Chart 1 shows the top 10 performing growth options over the year, all of which are non-profit funds.
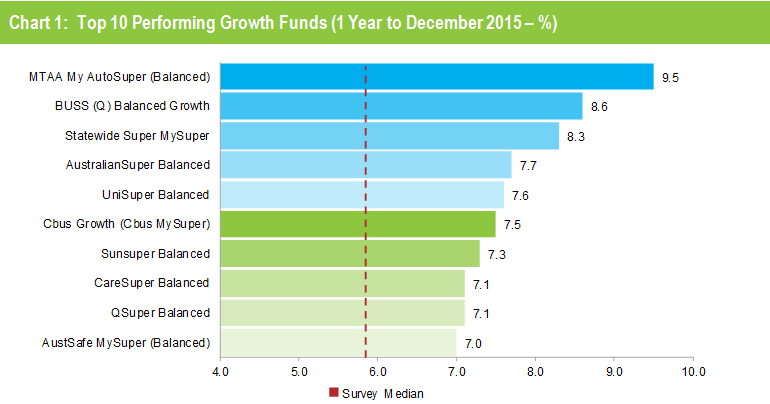
Source: Chant West
Notes:
1. The top 10 is limited to growth options with assets of $1 billion or more.
2. Performance is shown net of investment fees and tax. It is before administration fees and adviser commissions
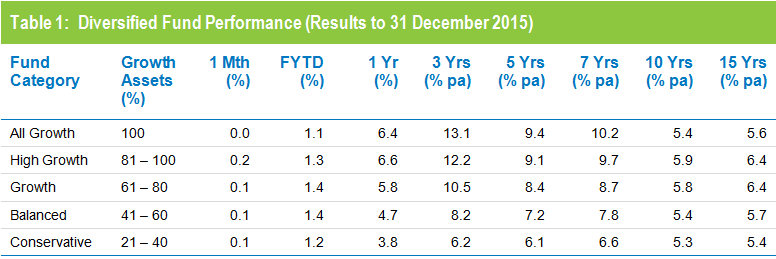
Table 1 compares the median performance for each fund category in Chant West's Multi-Manager Survey, ranging from All Growth to Conservative. The three, five and seven year returns reflect the mainly strong performance of listed shares and property over the post-GFC period, so the more aggressive fund categories, which have a higher proportion invested in those assets, have produced the best performance. The seven year returns have improved significantly over the past year as the worst of GFC has now dropped out of the calculation.
Source: Chant West
Note: Performance is shown net of investment fees and tax. It is before administration fees and adviser commissions.
Funds have done what they set out to do
While 2015 yielded only modest returns, and so far in January funds have retreated about 3%, Chant encourages members to think long term. "Most people working today will eventually convert their super into income streams to live on, so that money will stay in the super system long after they retire. It really is a lifetime investment, and there will be good times and bad times along the way. What's important is to know what your fund's risk and return objectives are and whether they're achieving them.
"Funds themselves think long term, and some of them are now reflecting that by setting their objectives over periods as long as 10 years. Typically, though, the return objective is still to beat inflation by 3% to 4% per annum over rolling five year periods. We now have data going back 23½ years to July 1992, which is when compulsory super commenced. When we look back over that very long period, we find that the annualised return is 8% and the annual CPI increase is 2.6%, so the real return above inflation has averaged 5.4% per annum. So over the longest period we can measure funds have well and truly met their return objective.
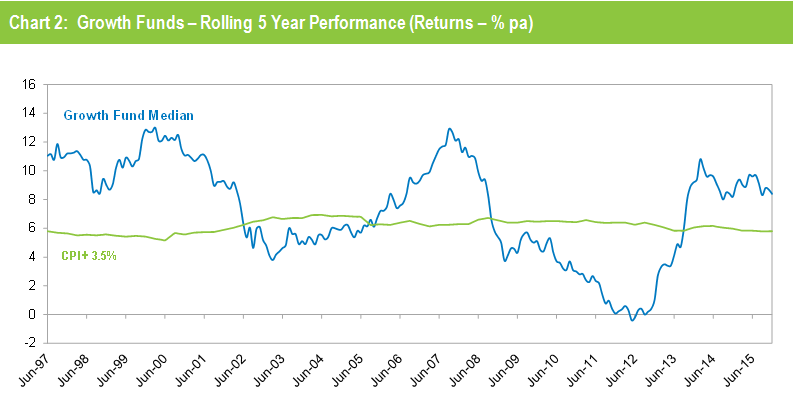
"That's borne out visually in Chart 2, which compares the growth category median with the average return objective for funds in that category (CPI plus 3.5% per annum after investment fees and tax over rolling five year periods).
Source: Chant West
Note: The CPI figure for the December quarter is an estimate.
"Until the GFC hit, the median fund outperformed the target most of the time. The GFC brought that to an abrupt halt, and the median fund dipped below the target line for several years. Now, with the GFC period having worked its way out of the calculation, the five year return has been tracking well above the target line for the past two years and more.
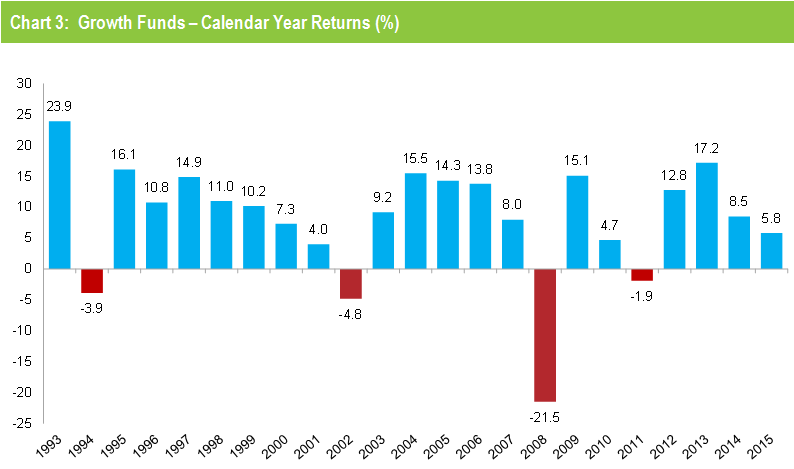
"In addition to their return objectives, most funds also set themselves a risk objective. Typically, for a growth fund, this is to post a negative return no more often than once in every five years on average. Chart 3 plots the year by year performance of the median growth fund over the full 23 calendar years since the introduction of compulsory super. In that time, there have been four years when returns were negative. That averages out to about one year in six, so the risk objective has also been met.
Source: Chant West
Note: Performance is shown net of investment fees and tax. It does not include administration fees or adviser commissions.
"So the message is that, while last year's median return may not have set the world on fire, over the longest period we can measure Australia's major super funds have done what they set out to do in terms of risk and return."
The investments that drove the performance
While there are differences between funds' investment strategies, even within the same risk category, most of their performance is driven by what happens in the major investment markets. For growth funds, that is primarily the Australian and international share markets, because those are the sectors where they allocate most of their money.
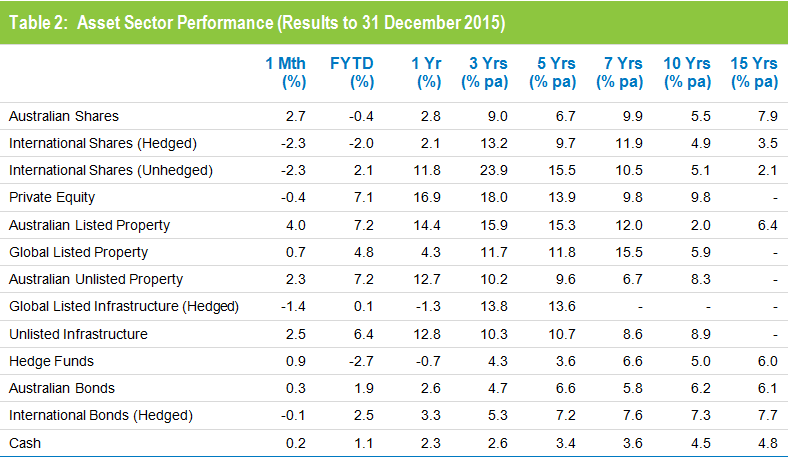
Table 2 shows the performance of all the main asset sectors over different time periods. We have used market indices for all sectors other than private equity and unlisted infrastructure. For those sectors, for which no indices exist, we have used the returns of a major fund in our survey that are representative of those markets.
Source: Chant West.
The key points to note for the 2015 calendar year are:
- Australian shares produced a small positive return of 2.8%.
- Unhedged international shares delivered a healthy return of 11.8%. However, most of that was due to the depreciation of the Australian dollar (down from US$0.82 to US$0.73), not the underlying markets. The return in hedged terms, which strips out the currency effect, was just 2.1%.
- Currency was a major contributor to performance, and overall we estimate that currency movements contributed about 1.7% to the typical growth fund return over the year.
- Of the traditional asset sectors, Australian listed property was the strongest performer with a return of 14.4%. Unlisted Australian property also produced a healthy return of 12.7%, while global listed property yielded a more modest 4.3%.
- Private equity was the strongest performing alternative asset sector with a return of 16.9%. Unlisted infrastructure also produced a strong return of 12.8%. Global listed infrastructure, however, was one of the two sectors that produced a negative return at -1.3%.
- Hedge funds was the other sector that was in negative territory for the year with a return of -0.7%.
- The main defensive asset sectors all delivered small positive returns, with Australian bonds, international bonds and cash gaining 2.6%, 3.3% and 2.3%, respectively.
Industry funds ahead of retail funds over the year and longer term
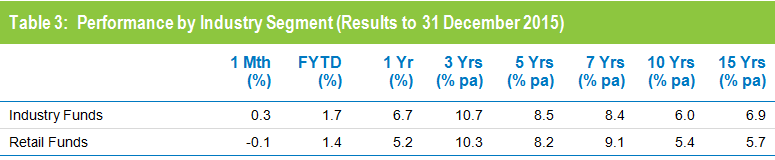
Industry funds outperformed retail funds over the year, returning 6.7% versus 5.2%. Industry funds also hold the advantage over the longer term, having returned 6.9% per annum against 5.7% for retail funds over the 15 years to December 2015, as shown in Table 3. Returns for most other periods shown are much closer.
Source: Chant West
Note: Performance is shown net of investment fees and tax. It does not include administration fees or adviser commissions.
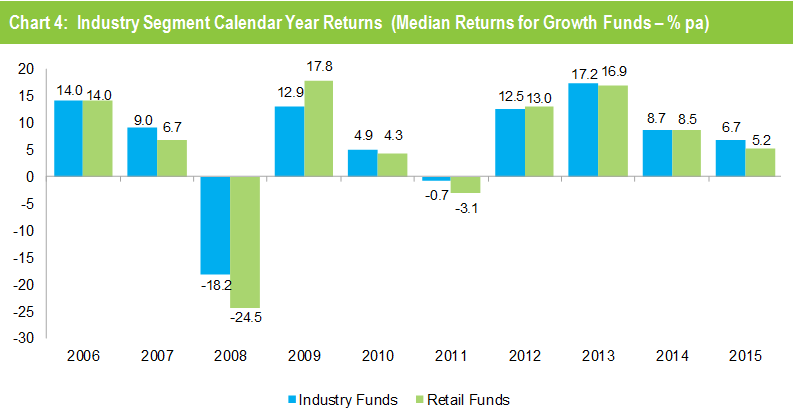
Chart 4 compares the performance of the two segments year by year over the past ten years.
Source: Chant West.
Chant says: "Over the longer term, industry funds have outperformed retail funds largely because, as a group, they tended to have lower allocations to listed shares during periods when shares underperformed. While that historical difference in allocation no longer applies, they have also had higher allocations to unlisted assets such as private equity, unlisted property and unlisted infrastructure which have performed well for them. That difference still applies, with industry funds currently investing 20% in these sectors against 5% for retail funds.
"Over the longer term, the asset allocation policies of industry funds have served them very well. Those allocations to unlisted assets do mean slightly higher investment costs, but those extra costs have been more than justified by the better performance and lower volatility.
"Industry funds have also been more prepared to shift away from their longer-term target asset allocations to take advantage of mispricing or to preserve capital. Overall, those medium-term shifts have had a positive effect on their performance."
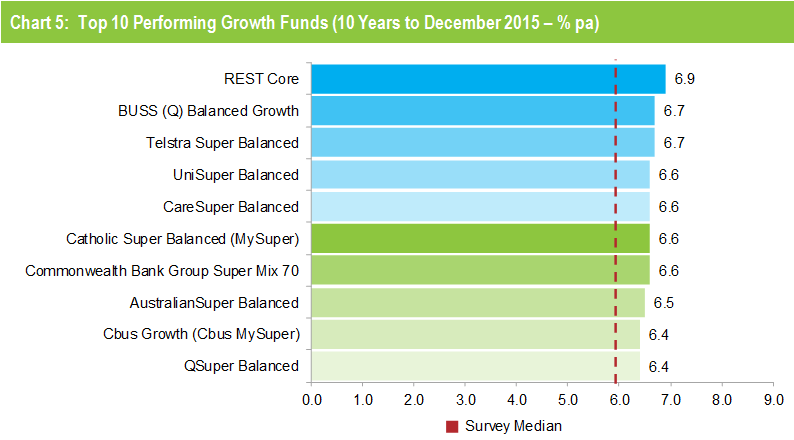
Chart 5 shows the top 10 performing funds over ten years. As has been the case for many years, the list is dominated by industry funds which account for seven of the ten places. The other three places are occupied by QSuper, which is a public sector fund and the stand-alone funds for employees of Commonwealth Bank and Telstra.
Source: Chant West
Notes:
1. The top 10 is limited to growth options with assets of $1 billion or more.
2. Performance is shown net of investment fees and tax. It does not include administration fees or adviser commissions.
