Super funds lost further ground after a tumultuous February, but a mid-month turnaround in share markets limited the damage. The median growth fund (61 to 80% allocation to growth assets) ended up retreating just 0.4%, bringing the return over the eight months of the financial year to date to -1.6%.
Australian shares were down 1.7% for the month. Hedged international shares fell 1.5% with the return in unhedged terms also in the red at -1.7%. Listed property was mixed, with Australian REITs up 2.8% but global REITs down 0.4%.
Chant West director, Warren Chant says: "Although growth funds were down 0.4% in February, things could have been much worse after share markets here and overseas sold off heavily in the first half of the month. Markets recovered ground in the second half of the month, and that recovery has continued in the first two weeks of March. We estimate that that median growth fund is up 1.9% in March so far.
"There has been much attention to the share market falls in the early part of this year but members need to remember that superannuation is for the long term. The typical return objective for growth funds is to outperform inflation by 3.5% per annum over periods of five years or longer, and funds have been delivering on this promise for a very long time.
"The lower return / higher volatility environment we're currently in is likely to continue for some time given the shaky economic backdrop. Many asset sectors are now close to being fully valued and it's proving challenging to identify future sources of growth. The downward pressure on investment fees presents another challenge as funds search for additional sources of return.
"In early February the US Federal Reserve Chair, Janet Yellen, warned that sharp share market falls in the first six weeks of the year together with the strong US dollar posed a threat to US economic growth, which pushed back expectations of a further interest rate increase. In Europe, the European Central Bank cut rates again earlier this month to an all-time low.
"There is continuing concern over the pace of growth of the Chinese economy. Meanwhile, back in Australia, GDP growth for the 2015 calendar year came in at a surprisingly healthy 3%. However, forecasts for 2016 are lower so a further rate cut from the RBA is still a live possibility."
Table 1 shows the median performance for each category in Chant West's multi-manager survey, ranging from All Growth to Conservative. Over three, five and seven years, all risk categories have met their typical long-term return objectives, which range from CPI + 2% for Conservative funds to CPI + 5% for All Growth. However, the GFC continues to weigh down longer-term returns. Over ten years the higher risk categories failed to achieve their objectives, but over 15 years the Growth, Balanced and Conservative funds did, while All Growth and High Growth fell slightly short having been hardest hit during the GFC.
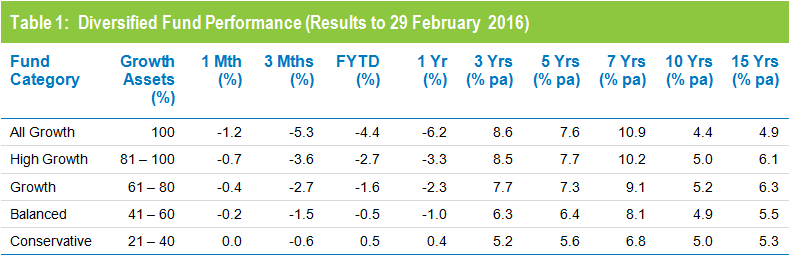
Source: Chant West
Notes: Performance is shown net of investment fees and tax. It is before administration fees and adviser commissions
Chart 1 compares the performance since July 1992 – the start of compulsory superannuation – of the Growth category median with the typical return objective for that category (CPI plus 3.5% per annum after investment fees and tax over rolling five year periods). The healthy returns in recent years, combined with the GFC period having worked its way out of the calculation, have seen the five year return rise sharply. For about two years it has been tracking well above that CPI plus 3.5% target.
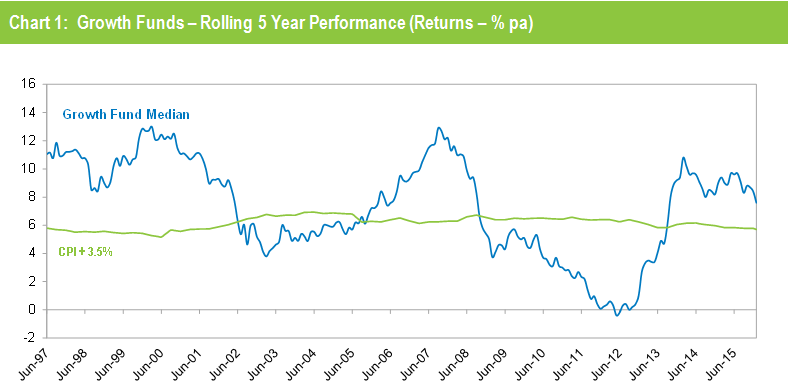
Source: Chant West
Note: The CPI figures for January and February 2016 are estimates.
Chart 2 compares the performance of the lower risk Conservative category (21 to 40% growth assets) median with its typical objective of CPI plus 2% per annum over rolling three year periods. It shows that Conservative funds have also exceeded their objective in recent years.
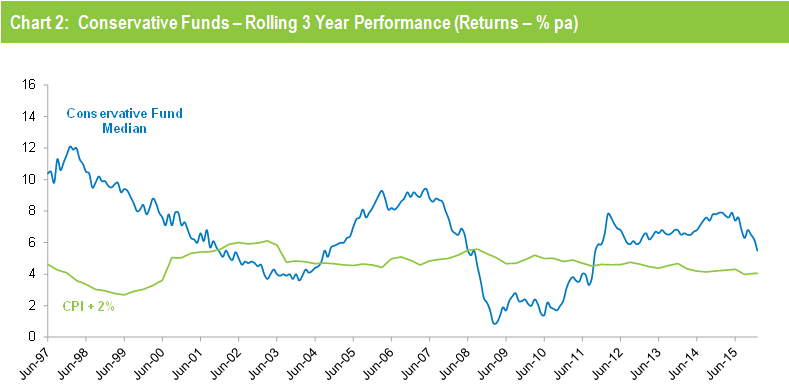
Source: Chant West
Note: The CPI figures for January and February 2016 are estimates.
Industry funds just edge retail funds in February
Industry funds and retail funds produced broadly similar results in February, with returns of -0.4% and -0.5% respectively. Industry funds still hold the advantage over the longer term, having returned 6.7% per annum against 5.4% for retail funds over the 15 years to February 2016, as shown in Table 2. Performance over three, five, seven and ten years is closer with retail funds actually ahead over seven years.
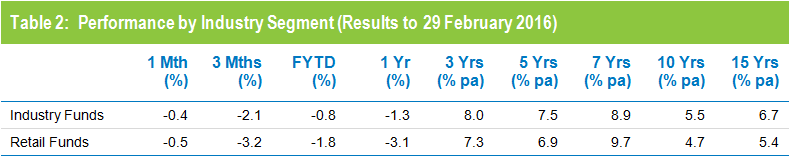
Source: Chant West
Note: Performance is shown net of investment fees and tax. It does not include administration fees or adviser commissions.
The industry funds' particularly strong outperformance over the year to February is mainly due to higher allocations to unlisted assets such as unlisted infrastructure, unlisted property and private equity which have outperformed listed markets over the period. Australian and international share markets, which are down 13.4% and 9.6%, respectively, over the past year, are marked to market. However, unlisted assets are valued infrequently with their valuations typically lagging listed markets by six to nine months.
