After a flat 2018, super funds had a strong start to 2019 on the back of rallying share markets. The median growth fund (61 to 80% in growth assets) gained 2.5% in January. Early February has seen the share market rally continue which has driven the median growth fund up a further 2.1% this month so far.
In January, Australian shares gained 3.9%. International shares surged 7.3% in hedged terms but the appreciation of the Australian dollar over the month (up from US$0.70 to US$0.73) reduced that gain 4.1% in unhedged terms. Listed property was also up with Australian and international REITs advancing 6% and 10%, respectively.
And the story continues to be positive in February. Chant West senior investment research manager Mano Mohankumar says: “Share markets have bounced back sharply over the first 7 weeks of the new year with Australian and international shares in hedged terms up about 7.5% and 10%, respectively so far. As a result, our estimated median growth fund return of 4.6% over this period has offset the losses from the disappointing December 2018 quarter when growth funds fell by 4.6%.
“It’s just another reminder to members that they should think of their superannuation as a long-term investment and not get distracted by short-term noise. As an example, if someone moved into a more conservative option after the sharp share market falls experienced over the December 2018 quarter, they would have not only crystallised their losses, but they would have missed out on the benefits of the rebound we’ve seen so far this year.
“The recent global share market rally has been on the back of optimism around a possible resolution of the trade dispute between the US and China. Markets were also buoyed by the US Federal Reserve highlighting greater flexibility in future interest rate decisions.
“However, we caution members not to get carried away with the early results for 2019. Much of the uncertainty dominating news last year hasn’t disappeared including those concerns around US-China trade relations, economic growth in a number of regions and Brexit. Additionally, most asset sectors are still close to or fully valued.”
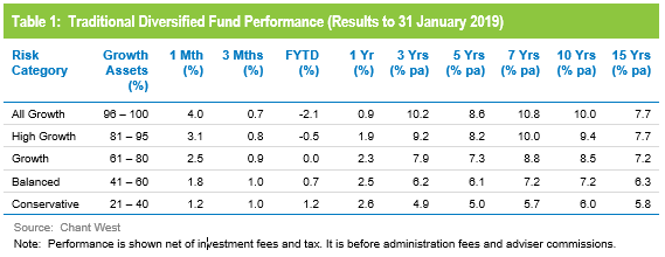
Table 1 compares the median performance for each of the traditional diversified risk categories in Chant West’s Multi-Manager Survey, ranging from All Growth to Conservative. All risk categories are now ahead of their long-term return objectives over 1, 3, 5, 7, 10 and 15 years.
Lifecycle products behaving as expected
Mohankumar says, “While our Growth category is still where most people have their super, a meaningful number are now in so-called ‘lifecycle’ products. Most retail funds have adopted a lifecycle design for their MySuper defaults, where members are allocated to an age-based option that is progressively de-risked as that cohort gets older.
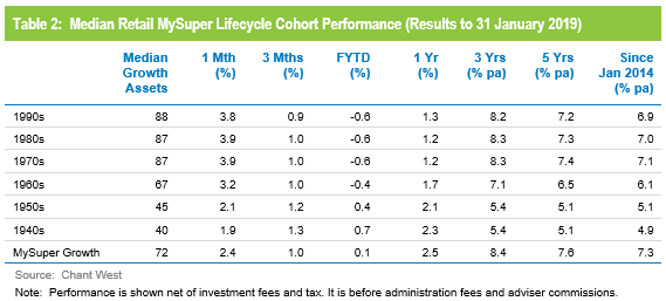
“It’s difficult to make direct comparisons of the performance of these age-based options with the traditional options that are based on a single risk category, and for that reason we report them separately. Table 2 shows the median performance for each of the retail age cohorts, together with their current median allocation to growth assets.”
While lifecycle is the most common MySuper default in the retail sector, most not-for-profit funds still use their traditional growth options for that default role. A few have gone down the lifecycle path, however, and while the general premise is the same the way it is implemented is different. Rather than allocating members to age-based cohorts as retail funds do, in the not-for-profit lifecycle model members typically ‘switch’ from one traditional risk category to another at particular ages. The diversified options that underlie these strategies are included in Table 1.
To help illustrate the early results of the retail lifecycle model, Table 2 includes a row for traditional MySuper Growth options – mainly, but not all, not-for-profit funds. Care should be taken when comparing the performance of the retail lifecycle cohorts with the median MySuper Growth option, however, as they are managed differently so their level of risk varies over time.
Aside from 2018, we have seen strong performance from growth assets in recent years so, as you would expect, the options that have higher allocations to growth assets have done best over three years, five years and since the introduction of MySuper (Jan 2014). Up until the share market falls over the December 2018 quarter, younger members of retail lifecycle products – those born in the 1970s, 1980s and 1990s – had held their own compared with the median MySuper Growth fund, but had done so by taking on more share market risk. However, despite a particularly strong January, their performance still lags the MySuper Growth median over one year, three years, five years and since the introduction of MySuper. This lag in performance is mainly due to the retail fund lifecycle cohorts being less diversified with a minimal allocation to unlisted assets.
The older age cohorts (those born in the 1960s or earlier) are less exposed to share market risk so they suffered less over the December quarter than the younger ones and less than the median MySuper Growth fund. That is what these products are designed to do. Capital preservation is more important at those ages so, while they miss out on the full benefit in rising markets, older members in retail lifecycle options should be better protected in the event of a market downturn. We saw that theory work well in practice over the December 2018 quarter.
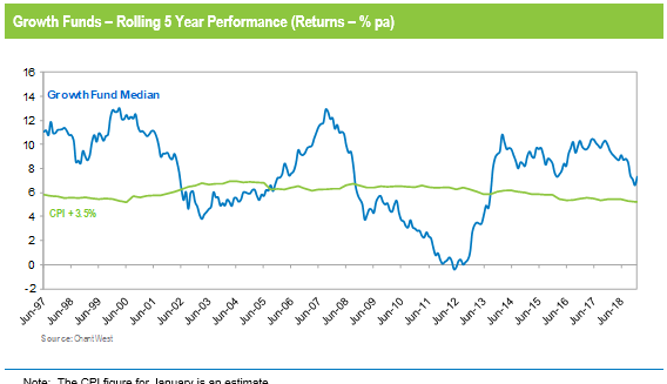
Long-term performance remains above target
MySuper products have been operating for less than five years, so when considering performance it is important to remember that super is a much longer-term proposition. The Chart below compares the performance since July 1992 – the start of compulsory superannuation – of the traditional Growth category median with the typical return objective for that category (CPI plus 3.5% per annum after investment fees and tax over rolling five-year periods). Notwithstanding the December 2018 quarter, the healthy returns in recent years have seen the longer-term performance tracking well above that CPI plus 3.5% target for the past five years.