After a tumultuous finish to 2015/16, super funds got off to a strong start in the new financial year with the median growth fund (61 to 80% allocation to growth assets) gaining 2.7% in July.
The strong performance was mainly the result of a sustained rally in share markets at home and overseas, reversing the sell-off that followed the shock 'Brexit' result in the UK in late June. Australian shares surged 6.4% over the month and hedged international shares rose 4.1% but, due to the appreciation of the Australian dollar (up from US$0.74 to US$0.76), this gain was reduced to 2% in unhedged terms. Listed property also rose, with Australian and global REITs up 5.4% and 5.1%, respectively.
Chant West director, Warren Chant says: "July was an excellent month, but we need to remember we're still in a low growth / higher volatility environment and this is likely to continue for some time. Investment markets have had a good run in recent years, but most assets are now fully valued or close to it so it's hard to find reliable sources of real return. That difficulty has only been compounded by the current political uncertainty, with the US election coming up in November and the consequences of 'Brexit' still to play out. So funds face a challenging period in terms meeting their long-term objectives, and members need to prepare for returns that are quite a bit lower than they've been used to.
"In July, markets in the Eurozone were supported by a strong earnings season and reassuring economic data despite Britain's decision to leave the European Union. While there remains much uncertainty in Britain, the political situation stabilised somewhat with Theresa May becoming the new Prime Minister.
"In the US, we've seen mixed economic data but strong company earnings results. Given the current level of uncertainty, expectations for further US interest rate rises have been pushed back.
"Closer to home, there remains concern over the pace of growth of the Chinese economy even though the most recent quarterly GDP data was better than expected. Meanwhile, back in Australia, we saw the RBA cut interest rates by 0.25% to a new all-time low of 1.5%, with further cuts this year remaining a distinct possibility."
Table 1 shows the median performance for each category in Chant West's multi-manager survey, ranging from All Growth to Conservative. Over three, five and seven years, all risk categories have met their typical long-term return objectives, which range from CPI + 2% for Conservative funds to CPI + 5% for All Growth. However, the GFC continues to weigh down some of the longer-term returns. Over 10 and 15 years, the Growth, Balanced and Conservative funds achieved their objectives but the higher risk All Growth and High Growth funds fell slightly short having been hardest hit during the GFC.

Source: Chant West
Notes: Performance is shown net of investment fees and tax. It is before administration fees and adviser commissions.
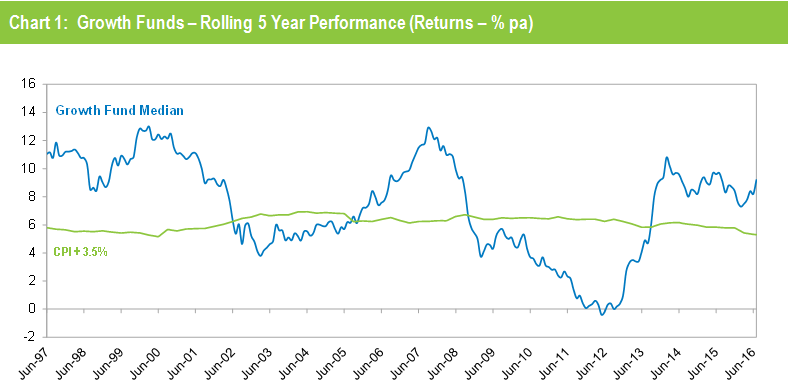
Chart 1 compares the performance since July 1992 – the start of compulsory superannuation – of the Growth category median with the typical return objective for that category (CPI plus 3.5% per annum after investment fees and tax over rolling five year periods). The healthy returns in recent years, combined with the GFC period having worked its way out of the calculation, have seen the five year return continue to track well above that CPI plus 3.5% target.

Source: Chant West
Note: The CPI figure for July 2016 is an estimate.
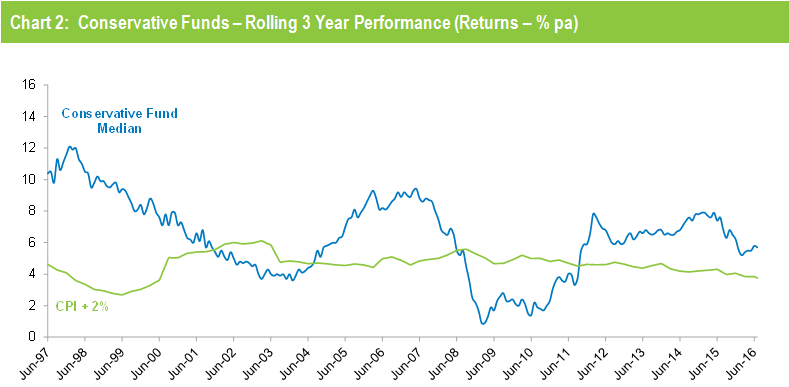
Chart 2 compares the performance of the lower risk Conservative category (21 to 40% growth assets) median with its typical objective of CPI plus 2% per annum over rolling three year periods. It shows that Conservative funds have also exceeded their objective in recent years.

Source: Chant West
Note: The CPI figure for July 2016 is an estimate.
Retail funds edge out industry funds in July
Retail funds slightly outperformed industry funds in July, returning 2.8% versus 2.6%. However, industry funds continue to hold the advantage over the longer term, having returned 7.1% per annum against 5.9% for retail funds over the 15 years to July 2016, as shown in Table 2.

Source: Chant West
Note: Performance is shown net of investment fees and tax. It does not include administration fees or adviser commissions.


