Super funds have delivered their strongest financial year result in 24 years, with the median growth fund (61 to 80% in growth assets) returning a stunning 18% for FY21. This is the second highest return since the introduction of compulsory superannuation in 1992 – the only better financial year result was 19.4% recorded back in 1996/97. Our growth fund category is where the majority of Australians have their superannuation invested. Mine Super Growth was the top performer for the year with a return of 22.6%, while even the worst performer in the category returned a respectable 13%.
Chant West Senior Investment Research Manager, Mano Mohankumar says the FY21 result is remarkable given financial disruption caused by COVID-19. "An 18% return would have been inconceivable a year ago and represents a welcome reward for fund members who held their nerve and remained patient through the depths of the COVID-induced market crisis.
"The experience over the past two years highlights the resilience and robustness of super funds' portfolios. Despite the battering that share markets took over February and March 2020, the diversification built into growth funds enabled them to limit the damage to a small loss of 0.6% for FY20 which was a much better result than expected. And in FY21, with over 50% allocated to listed shares, these funds were able to capture a meaningful proportion of the upside as markets staged a strong and sustained rally. In fact, growth funds finished FY21 more than 10% above the pre-COVID crisis high that was reached at the end of January 2020.
"The better performing funds over the year were generally those that had higher allocations to listed shares, and particularly to international shares. Australian shares gained an impressive 28.5% while international shares surged 37.1% in hedged terms. The traditional defensive sectors such as bonds and cash were the weakest performers over the year, so keeping a low allocation to those would have helped performance. Cash was virtually flat with a return of just 0.1% while Australian and international bonds fell 0.8% and 0.2%, respectively. Of the alternative asset sectors, private equity was the strongest performer delivering over 40% on average. Funds would also have benefited from keeping their foreign currency exposure low, given the relative strength of the Australian dollar (up from US$0.69 to $0.75).
Chart 1 shows the top 10 performing growth options over the 2020/21 financial year, together with the survey median.

Other key content:
-
Diversified fund performance by risk category
-
Top 10 performing growth funds over 10 years
-
Retail lifecycle product performance
-
Long-term performance including rolling 10 year returns chart
-
Risk objectives and financial year by year performance chart
Table 1 compares the median performance for each of the traditional diversified risk categories in Chant West's Multi-Manager Survey, ranging from All Growth to Conservative. Over all periods shown, all risk categories have met their typical long-term return objectives, which range from CPI + 2% for Conservative funds to CPI + 4.25% for All Growth.
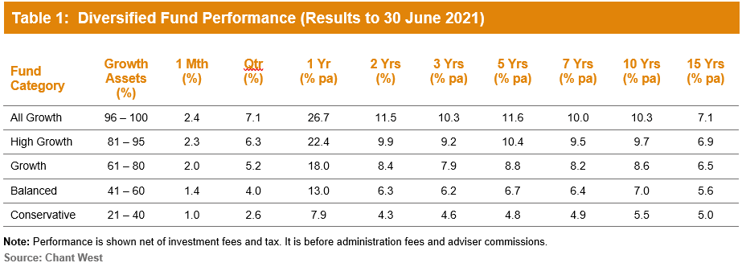
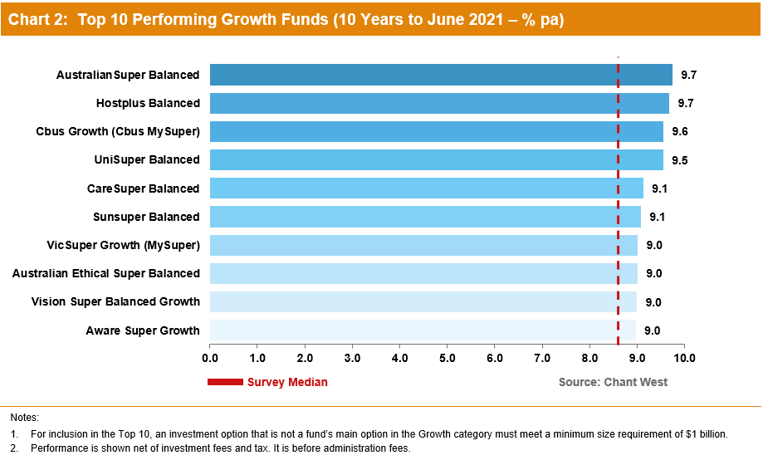
Chart 2 shows the top 10 performing growth options over 10 years, together with the survey median.
Lifecycle products behaving as expected
Mohankumar says that while the Growth category is still where most people have their super invested, a meaningful number are now in so-called 'lifecycle' products. "Most retail funds have adopted a lifecycle design for their MySuper defaults," he says, "where members are allocated to an age-based option that's progressively de-risked as that cohort gets older.
"It's difficult to make direct comparisons of the performance of these age-based options with the traditional options that are based on a single risk category, and for that reason we report them separately. Table 2 shows the median performance for each of the retail age cohorts, together with their current median allocation to growth assets. For comparison purposes it also includes a row for traditional MySuper Growth options – nearly all of which are not-for-profit funds. Care should be taken when comparing the performance of the retail lifecycle cohorts with the median MySuper Growth option, however, as they're managed differently so their level of risk varies over time."
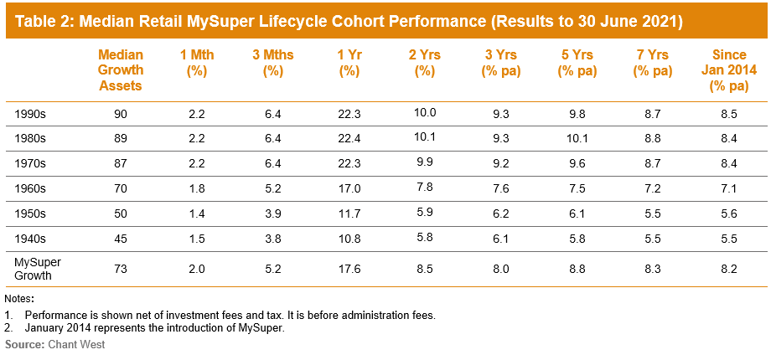
As a result of the strong recovery since the end of March 2020, the options that have higher allocations to growth assets have now done better over all periods shown. Younger members of retail lifecycle products – those born in the 1970s, 1980s and 1990s – have outperformed the MySuper Growth median over all periods shown. However, they've done so by taking on significantly more share market risk. On average, these younger cohorts have at least 20% more invested in listed shares and listed real assets than the typical MySuper Growth option.
The older cohorts (those born in the 1960s or earlier) are relatively less exposed to growth assets so you would expect them to underperform the MySuper Growth median over longer periods. Capital preservation is more important at those ages, so while they miss out on the full benefit in rising markets, older members in retail lifecycle options are better protected in the event of a market downturn.
Funds still delivering on long-term targets
While much of the focus at this time of year is on financial year performance, Mohankumar reminds fund members to think long term. "Super funds have had a tremendous year with a median return of 18% but returns at that level shouldn't be thought of as normal. The typical long-term return objective for growth funds is to beat inflation by 3.5% p.a., which translates to about 5.5% to 6% p.a. We now have data going back 29 years to July 1992, the start of compulsory super. Over that period, the annualised return is 8.2% and the annual CPI increase is 2.4%, giving a real return of 5.8% p.a. – well above that 3.5% target. Even looking at the past 20 years, which now includes three major share market downturns – the 'tech wreck' in 2001-2003, the GFC in 2007-2009 and COVID-19 in 2020 – super funds have returned 6.9% p.a., which is still comfortably ahead of the typical objective."
Chart 3 shows that, for the majority of the time, the median growth fund has exceeded its return objective over rolling ten-year periods, which is a commonly-used timeframe consistent with the long-term focus of super. The exceptions are two periods between mid-2008 and late-2017, when it fell behind. This is because of the devastating impact of the 16-month GFC period (end-October 2007 to end-February 2009) during which growth funds lost about 26% on average.

Returns are important but risk matters too
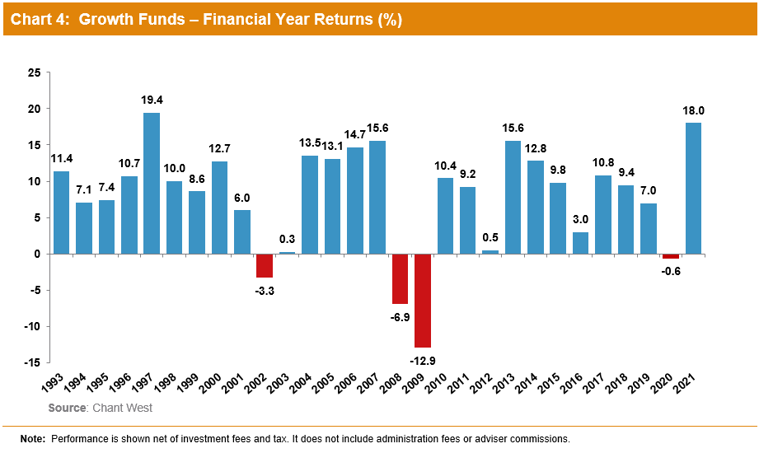
"Returns are important but so is risk, and most funds also set themselves a risk objective. Risk is normally expressed as the likelihood of a negative annual return, and typically a growth fund would aim to post no more than one negative return in five years on average. Chart 4 plots the year-by-year performance of the median growth fund over the 29 financial years since the introduction of compulsory super. The objective would be no more than five negative years in that time. As it turns out there have only been four, so the risk objective has been met as well as the performance objective." Mohankumar said.
"Over the longest period we can measure, Australia's major super funds have delivered on their promises to members, growing their wealth in real terms while protecting them from undue risk. That's a great achievement, and it's a message that should be conveyed as widely as possible. Super has proven to be a great way to invest, and people should be confident entrusting their savings to the major Australian funds that are among the best in the world. They have their detractors who claim they are not delivering for members, but by their actions and results they continue to prove those detractors wrong."
Download a PDF copy on this media release here
