Super funds got off to a good start for the 2015/16 financial year, with the median growth fund (61 to 80% growth assets) gaining 2.3% for the month of July. This is on the back of an impressive 9.8% return for the year ended 30 June, which was the sixth consecutive positive financial year.
After significant losses over last the two weeks of June, listed share markets, which are the main drivers of growth fund performance, bounced back strongly in July. Australian shares were up 4.3% and international shares advanced 2.4% in hedged terms, but again currency had a major impact, as it has over the past year. The Australian dollar’s continuing decline against the US dollar (down from US$0.77 to US$0.73 over the month) saw the unhedged return from international shares reach 6.6%. Listed property also had a strong month, with Australian and global REITs up 5.7% and 4.6%, respectively.
Chant West director, Warren Chant says: “Many super funds have just come off three consecutive double-digit financial year returns, and July gave them a strong start to the new year. That’s the good news, but the outlook from here isn’t quite so rosy. So far in August we’ve seen share markets retreat, and as a result the median growth fund has already lost much of July’s gain.
“More ominously, the general consensus among asset managers is that we’re entering a low growth period. They report that many asset sectors are now close to being fully valued and it’s becoming harder to identify sources of future growth. So members should expect returns to be much lower, in the medium-term at least, than what they’ve seen over the past three years. In fact, some investment experts are questioning funds’ ability to meet their investment objectives over the next decade, not just for growth options but also for other risk categories.
“In the month of July, the Euro zone was the best performing market. The immediate concerns about Greece were eased with the last-minute agreement of another bailout deal and, more importantly, the latest economic data indicates that the region’s economic recovery is continuing. The US share market also performed well on the back of generally positive economic data.
“In China, shares fell sharply and economic data remains mixed. Meanwhile, back in Australia, the Reserve Bank left the official interest rate at a record low of 2%, with the possibility of another rate cut by the end of the year.”
Table 1 compares the median performance for each category in Chant West’s multi-manager survey, ranging from All Growth to Conservative. The one, three and five year returns reflect the strong performance of listed shares and property, so the more aggressive fund categories, which have a higher proportion invested in those assets, have produced the best performance. The seven year returns, while still weighed down by the ‘GFC effect’, are gradually improving as the GFC period continues to drop out of the calculation.
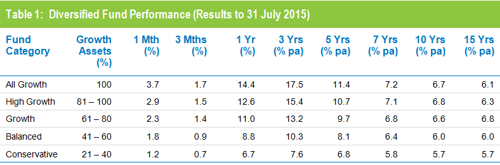
Source: Chant West
Note: Performance is shown net of investment fees and tax. It is before administration fees and adviser commissions.
Chart 1 compares the performance since July 1992 – the start of compulsory superannuation – of the Growth category median with the typical return objective for that category (CPI plus 3.5% per annum after investment fees and tax over rolling five year periods). The strong returns in recent years, combined with the GFC period having worked its way out of the calculation, have seen the five year return rise sharply. For the past 18 months or so it has been tracking well above that CPI plus 3.5% target.
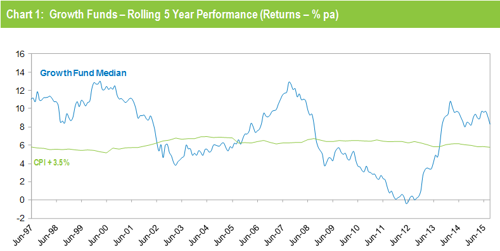
Note: The CPI figure for July 2015 is an estimate.
Chart 2 compares the performance of the lower risk Conservative category (21 to 40% growth assets) median with its typical objective of CPI plus 2% per annum over rolling three year periods. It shows that Conservative funds have also exceeded their objective in recent times.
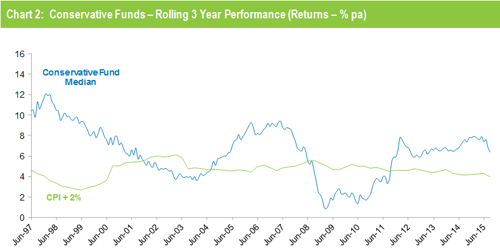
Note: The CPI figure for July 2015 is an estimate.
Retail funds ahead of industry funds in July
Retail funds outperformed industry funds in July with a return of 2.6% versus 2.3%. Industry funds still hold the advantage over the longer term, having returned 7.1% per annum against 6% for retail funds over the 15 years to July 2015, as shown in Table 2. However, performance over periods of seven years and less is much closer.
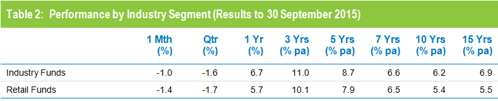
Source: Chant West
Note: Performance is shown net of investment fees and tax. It is before administration fees and adviser commissions.
