The two main weaknesses of our superannuation system are the proliferation of multiple member accounts and the defaulting of members into underperforming funds. These are both problems that have been highlighted by the Productivity Commission, and they need to be fixed in order to make the system more efficient and deliver improved retirement outcomes. Identifying underperforming funds is the focus of this article and is also the focus of APRA’s newly launched ‘Heatmap’. APRA’s methodology is broadly similar to ours and we comment later on what it could mean for our industry.
The problem of unintended multiple accounts could be solved relatively simply by changing how the default fund procedure works. People often drift into having multiple accounts because, when they start a new job, what happens to their new employer’s contributions is not the most important thing on their minds. Since they are unlikely to take positive action, the way to save them from inadvertently starting yet another account is to have the new contributions directed into their most recent active account.
This was the Productivity Commission’s ‘Default Once’ recommendation and the Royal Commission’s ‘Stapling’ recommendation and it makes absolute sense. Combined with a more streamlined process for consolidating existing accounts, such as integrating it with the TFN notification process, this would go a long way towards the ideal where most members carry just one default super fund with them throughout their working lifetime.
The second problem of defaulting members into underperforming funds is more complex and any solution is likely to be more contentious. The Productivity Commission’s favoured solution was to limit the funds to which members could be defaulted to the Top 10 so-called ‘Best in Show’. This approach, while superficially appealing, has many shortcomings.
One is that it is too restrictive on employers. We have run many corporate super tenders over the years where the successful fund was not in the top ten according to our ratings criteria. Our medium to large employer clients chose funds that were better suited to their particular needs – perhaps because they could replicate the existing insurance design or because their member services were regarded as superior.
Perhaps the biggest shortcoming of the Top 10 approach, assuming it would have a high weighting to investment performance, is that it would be inherently unstable. The performance differential between the 20 top-performing funds is quite small, so any list of the ten top-performing funds will be constantly changing. Table 1 shows the 10 top-performing Growth options (61 to 80% growth assets) for 10 years to 31 December 2018, 30 June 2019 and 30 September 2019. The highlighted funds are the only ones that appear in the top 10 over each period – there are only five!
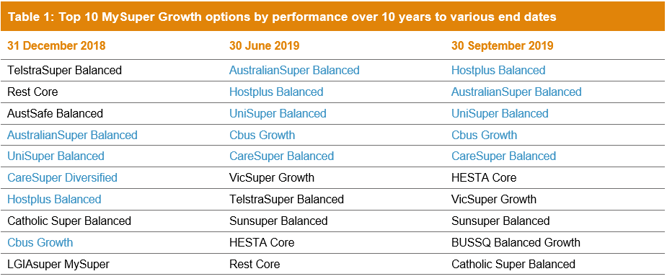
Note: Performance figures used are net of investment fees and tax (gross of administration fees).
We also get different results if we choose different periods for measurement. Table 2 shows the 10 top performing growth options over 15, 10 and 7 years to 30 September 2019 – all of which could be considered to be longer term. Again, the highlighted funds are those that appear in the top 10 over each period – and again there are only 5. A position on or off the list could be a ‘make or break’ for some funds, so which period to choose? The relatively arbitrary decision on which end date or timeframe to use can determine half of the top 10 list.
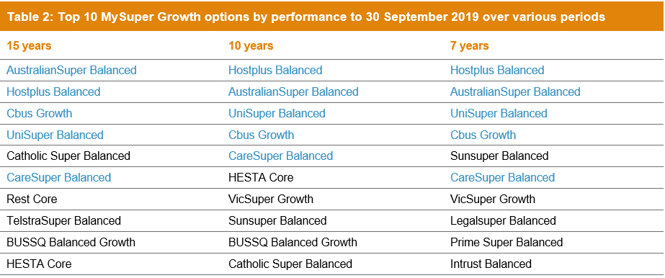
Note: Performance figures used are net of investment fees and tax (gross of administration fees).
There is currently also a timing issue where some funds have become concerned with the overvaluation of investment markets and have dialled down their equity exposure to protect members from an anticipated correction. In doing so they have shown a preparedness for their performance to be significantly different from their peers. Such an approach may be very appropriate given the average age of their members. If the top 10 funds were chosen now, simply based on performance, it would penalise all those that have taken action to protect their members in good faith, but in hindsight may have done so too early. If a market correction were to take place, the top 10 funds could look very different.
A better way
Rather than nominate an arbitrary number of funds, a better solution is to identify a qualifying standard that funds have to meet in order to retain their MySuper status. This was the Productivity Commission’s ‘Right to Remain’ test. Funds that do not meet this standard may lose their right to retain their MySuper status and would need either to rectify their shortcomings to APRA’s satisfaction or else surrender their MySuper licence. The merit of this approach is that it would apply objective criteria to identify and potentially remove underperforming funds without the risk of penalising the many very good funds that just fail to make the Top 10.
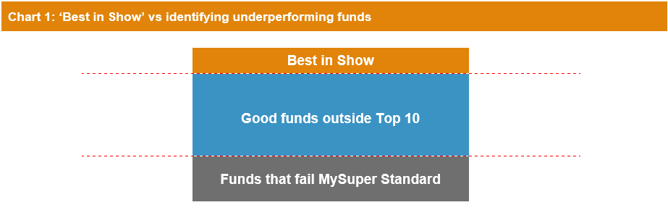
Chart 1 below illustrates the difference between applying the ‘Best in Show’ and the ‘Right to Remain’ tests. The ‘Right to Remain’ test focuses on removing the underperforming funds shown in the grey segment, which is the recognised problem, whereas ‘Best in Show’ would also remove many good funds in the blue segment.
There has been much talk about the ‘Right to Remain’ test but little on how the test could work. Given that Chant West has access to all the data necessary to formulate such a test, we have looked at how it might be conceived and structured.
We should note here that the object of this exercise is not the same as when we analyse funds as part of our ratings process. That process calls for a comprehensive examination of all the factors that contribute to the member experience and to retirement outcomes. Some of these factors – for example member services, insurance design and organisational strengths – are less measurable than others and involve us exercising our professional judgement based on our in-depth interaction with the funds. This information and the insights we gain from it would be difficult to fit into a “Right to Remain” test or a Heatmap so we have restricted our suggestion for the ‘Right to Remain’ test to areas that are both objective and measurable.
We believe there are two main areas that should be considered, namely investments and fees. We considered factoring in insurance premiums, but that area is problematic as insurance cover and premium levels are highly dependent on each fund’s membership demographic profile. Likewise, we have not included sustainability measures (metrics such as scale, cashflows, membership trends, active member ratios etc). These are forward-looking measures that provide insights as to the future stability and growth of a fund and its ability to continue to deliver strong member outcomes. APRA does collect this information, but we believe it is best used as part of its outcomes assessment, especially for underperforming funds, rather than as an input to the ‘Right to Remain’ test.
Investment performance – but compared with what?
Clearly, investments are the most important area to consider if we are to identify underperforming funds. In our own ratings procedure we give a lot of weight to factors other than past performance, because what we are looking for is the likelihood of a fund producing strong long-term returns in the future. These factors include investment governance, the fund’s own investment resources, its use of external advisers, its asset allocation policies and so on.
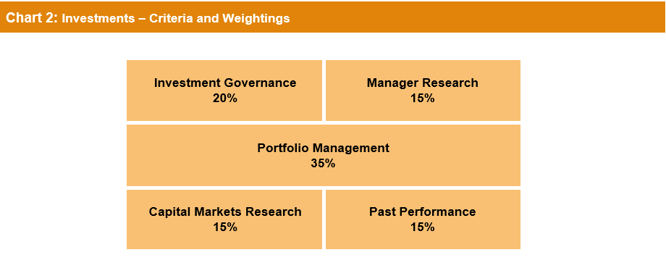
Chart 2 shows the high level criteria we consider and their weightings. Each of these criteria has a number of sub-criteria that we score.
When we look back on our past ratings we find that they are quite consistent with the ensuing performance – in other words they have been very good predictors. Funds that we assessed as strong in these areas 10 to 15 years ago have generally performed well since that time.
This sort of analysis is probably not appropriate for inclusion in a Heatmap as it would require the application of professional judgment for areas like investment governance, how a fund works with its investment consultant, the resourcing and experience of the investment team, and the structure of its portfolios. No doubt APRA would look at these issues as part of its ongoing supervisory work with funds but for a ‘Right to Remain’ test or Heatmap, an objective series of metrics is more appropriate to be used and applied in a consistent manner across all funds. This means that in a Heatmap, or the setting of objective benchmarks for a ‘Right to Remain’ test, we are probably stuck with measures of past performance – preferably past performance taking risk into account in some way. But we need to acknowledge the limitations of this approach as strong past peer-relative performance does not secure strong future peer-relative performance.
We believe the best measure of investment performance is the return after investment fees and tax, which APRA calls the ‘net investment return’. By deducting investment fees and costs, but not administration fees, we can identify whether any underperformance at the member level is attributable to investments rather than just higher administration fees. This is better than the ‘net of all fees’ measure which can be distorted by historically higher administration fees that no longer apply. Administration fees are important but are best considered as a separate matter from investments.
We now need to decide on the appropriate period(s) of measurement which, as we saw earlier, can have a significant effect on funds’ relative performance. Ideally, we would want a period that spans at least one full market cycle and is long enough to remove the short-term ‘noise’. Ordinarily, something like 10 years would be appropriate to ensure we incorporate a full market cycle but given the length of the current market cycle, an even longer timeframe would be required for that. However, since the MySuper regime only came into force in January 2014, we only have 5½ years of performance history to 30 June 2019 upon which to assess funds. It must be acknowledged that this is a very short period to determine the success of a fund’s investment strategy and whether it deserves to retain its MySuper status. This is especially the case since the period does not include a sustained market downturn and more cautious strategies designed to protect the downside for members have not paid off in this period. For those funds where their MySuper offering is simply a continuation of their previous default options, we have been able to use their 10-year performance as a further data point for comparison.
The next step is to determine a suitable benchmark against which to measure these returns. Here we need a measure that ‘sets the bar’ so we can differentiate between funds that are meeting a reasonable standard and those that are underperforming. One suggestion is that funds should be measured against their own stated objectives, which are typically framed as ‘CPI + x% per annum over y years’. We would reject this on two main grounds. Firstly, if failing to meet a self-imposed objective had negative consequences with the regulator there would be a motivation for funds to set that objective as low as possible. Secondly, just as a rising tide lifts all boats, strong investment markets would likely see all funds achieve their objectives (and conversely fail to meet their objectives in a protracted market downturn). This would not be helpful when the objective is to identify underperforming funds.
We could of course simply compare the performance of all MySuper products. However that assumes a degree of homogeneity that does not exist. The problem is risk. MySuper portfolios range from 95% growth assets down to about 20% growth assets so they are very different in terms of their risk/return profiles. At a time like now, when markets have been favourable to growth assets for several years, funds at the higher end of the risk spectrum have typically been rewarded with higher returns. So risk has paid off in recent years but that will not always be the case. Even if we were to limit our comparison to funds in the same risk category (High Growth, Growth, Balanced and Conservative in our terminology) we would still not be recognising the variation in risk between products in a particular category – for example our Growth category has a range of 61 to 80% growth assets. Indeed, the performance of a fund with about 80% growth assets over the past 10 years would have been about 1% per annum higher than a fund with 61% growth assets, simply due to the level of growth assets.
Similar risk reference portfolios highlight added value
We believe a better way to assess funds’ performance is to compare them with reference portfolios with a similar level of risk, which is the approach advocated by the Productivity Commission. A reference portfolio is a vanilla passive portfolio with a given level of risk, preferably constructed from investible market indices and measured net of tax. If a MySuper fund is doing its job well, we would expect to see evidence of added value against this passive benchmark of similar risk.
For our analysis we have used a simplified version of the Productivity Commission’s BP1 reference portfolio using each fund’s growth/defensive split as the measure of risk. We know there is inconsistency in the way funds categorise their assets as growth or defensive, especially in the case of unlisted property and infrastructure, so for the purpose of this exercise we have adopted a ‘normalised’ metric by treating those unlisted assets as 50% growth for all funds. We have, however, accepted each funds’ own categorisation of alternative assets as there is no simple way for us to assess the nature of these portfolios. APRA takes a slightly different approach, classifying unlisted property and unlisted infrastructure as 75% growth and alternatives as 50% growth.
For each MySuper product we have constructed a reference portfolio by combining the growth and defensive assets shown in Table 3 in proportions that match our normalised growth/defensive assessment for that product each year. This includes lifecycle products where the reference portfolios used for each year reflects the average level of growth assets over the year, which for certain lifestages changes quite significantly over a 5-10 year period.
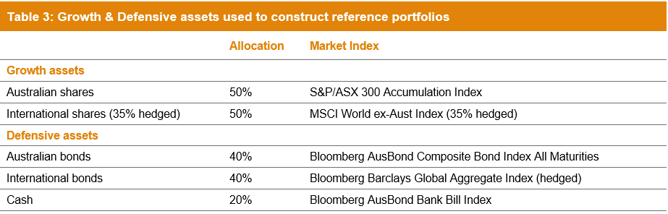
Note: The 35% hedging level for international shares is close to the median in our asset allocation surveys in recent years.
Compared to the reference portfolio that APRA is using in its Heatmap analysis, there is no difference in the defensive asset composition and the only difference in the growth asset composition is the hedging percentage on international shares (we have used 35% versus APRA’s 50%). Our tax assumption is the most significant difference from APRA’s methodology where the effective tax rate is built up from tax assumptions for individual asset sectors. APRA assumes a zero tax rate for Australian shares and either 14% or 15% for all other asset sectors. We have used the tax rates from ASIC’s MoneySmart website for portfolios with different levels of growth assets, increased by 0.5% p.a. as we believe ASIC’s tax rates are a little low (but this difference makes negligible difference to the overall results).
We need to make some further comments on lifecycle MySuper products. While our reference portfolios track the glide path over time, our analysis does not recognise the possible value added through the design of the glide path itself. With most lifecycle strategies, younger members have 85% to 90% invested in growth assets – more than the typical growth fund (73% on average) – which intuitively makes sense as they can afford to take on more risk at younger ages. But that does not mean that lifecycle strategies are better than traditional growth options or will lead to better investment outcomes. That is because the rate of de-risking is a key variable that can have an even more significant impact on a member’s balance at retirement, given that balances are higher at older ages. While such product design may be beneficial to members, it is very hard to incorporate these benefits into a simple test for underperformance.
The results
To analyse the results, we have separated MySuper products according to their design. That is because some lifecycle products do well for some age cohorts but not for others. There are currently 82 MySuper products on offer, excluding a few tailored options from AMP, Mercer and MLC. Of these, 63 are single strategy (or have been for most of the period from 1 January 2014, noting three have recently converted to lifecycle) and 19 have been lifecycle for the whole period.
For our test, we have set the pass mark as a return above or within 40 basis points of the reference portfolio return (the 40bps is to take into account investment fees for a passive portfolio, custody costs, advice on asset allocation, and to build in a small margin for error). Table 4 shows that 42 single option MySuper products passed the test when measured from January 2014, but 21 failed the test. For lifecycle products, we have judged them to have met the standard if they passed the test for at least half of the lifestages. On that basis 10 passed the test while 9 failed.
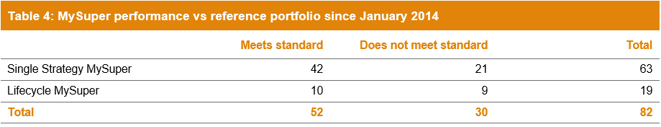
However, we need to remember that 5½ years is quite a short period of time over which to judge a fund’s performance. If we extend our measurement period to 10 years, which is possible for the vast majority of single strategy MySuper options, a further three single option MySuper products pass the test. Very few lifecycle funds have a 10-year performance record so the result for that group is unchanged. We do not believe it is valid to attach the performance of retail funds’ precursor default options to their lifecycle fund performance in a ‘Right to Remain’ test as these superseded options were managed in a very different way. In any case, if we did include these precursors it makes no difference to which funds meet the standard as these earlier defaults generally did not perform well over the four to five years before MySuper.
At first glance, it has to be said the results are not particularly encouraging. We would award passes to about 63% of funds in the MySuper era, and 67% if we stretch the measurement period back the full 10 years. That may be a very concerning for the industry as a whole if there was no explanation, but there are some factors that explain the results.
The past 10 years have seen strong returns from Australian shares (averaging 9.9% per annum), international shares (12.4% unhedged and 11.3% hedged) and from traditional defensive assets (Australian bonds 6.0% and international bonds 6.6%). In other words, the traditional sectors from which we have built our reference portfolios have had a good run compared with alternative assets such as hedge funds which are often used to diversify portfolios. The past 5½ years has also been a difficult period for active managers to add value, with active managers struggling to match market indices in the major list asset classes. While active management has struggled somewhat, we expect it to perform better than passive management in the event of a sustained market downturn, which we have not seen since the introduction of MySuper.
But how about risk?
Another point to consider is that the growth/defensive split is a very basic proxy for risk. We use it in our analysis for simplicity and because it uses information that would be available to APRA, but we are not suggesting that a modern well-diversified 70/30 portfolio really has the same risk profile as one constructed only from share, bond and cash indices. Modern portfolios have evolved over the past ten years in the aftermath of the Global Financial Crisis (GFC). Throughout that period funds have been taking steps to make their portfolios more resilient, mainly through further diversification. We have seen significant amounts of money reallocated from shares, bonds and cash to unlisted assets and alternatives, partly in search of new sources of return but also to provide members with a smoother journey and to cushion them from a GFC-like shock.
We could look at alternative risk measures such as short-term volatility and Sharpe ratios, which would seem to indicate that today’s funds carry much less risk than the equivalent reference portfolios. However, these metrics need to be treated with caution, especially for portfolios with significant exposure to unlisted assets that may only be valued once or twice a year.
A more meaningful and obvious measure of risk is drawdown (peak to trough loss). Table 5 compares the drawdown for our median MySuper Growth fund with the drawdown of our 70/30 reference portfolio comprising only listed shares, bonds and cash. We have looked at two extended periods of sharemarket weakness, the tech wreck and the GFC, and two much shorter periods, the European debt crisis in mid-2011 and the heightened trade tensions in the December 2018 quarter. It can clearly be seen that the median MySuper Growth fund has provided a greater cushion than the reference portfolio during each of those four periods.
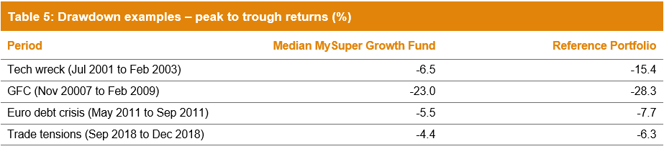
Note: Performance is shown net of investment fees and tax. It is before administration fees.
It is also important to remember that, due to compounding, the difference in the positive return a member would have needed to recover their loss is greater than the difference in the drawdown. For example, during the GFC the median MySuper Growth fund lost 23% while the reference portfolio lost 28.3% (a difference of 5.3%). However, a member in the median MySuper Growth fund would have needed a return of 30% to fully recover their losses, while someone invested in the reference portfolio would have needed nearly 39.5% (a difference of 9.5%).
Administration fees have an impact too
Clearly, investments are the most important consideration in assessing the quality of a MySuper product, but fees also have an impact on members’ retirement outcomes. ‘High fees’ is a common catchcry but we think it is important to differentiate between investment fees and administration fees. Investment fees are costs that funds incur in the interests of generating returns, and we would not want to penalise funds that incur higher fees if they lead to stronger returns. In any event, investment fees are already taken into account in our analysis of performance because we measure returns net of investment fees and tax, so they do not need to be considered further. For this reason, our ‘Right to Remain’ test only considers administration fees and other costs including expense recoveries and regulatory levies but does not consider investment fees. APRA’s Heatmap considers both administration fees and total fees (which includes investment fees).
The main drivers of administration fees are the scale of a fund, its business model (retail or not-for-profit) and the level of services it provides. Service levels are difficult to capture in a test like this, but we can still determine a fee level that we know from experience would allow for an acceptable standard of services. We are aware that retail funds offer significant fee reductions for larger employers, but our focus is on the standard MySuper fee as this is what members generally pay after leaving their large employer.
Given the simplicity of the MySuper product we believe it is reasonable to set a maximum administration fee level of 0.60% per annum, assuming a $50,000 balance. When we applied this test to all MySuper products, 18 of the 82 products failed the test. The majority of these are retail funds whose standard MySuper fees are relatively high. If a maximum administration fee was introduced at this level, we expect most retail funds would simply reduce their standard fees to meet the requirement, which would be a good outcome for members. They may try to shift fees from administration to investments, but this would have the effect of reducing returns. The other funds that would fail this test are smaller industry funds, reflecting the challenges of providing low cost super to a smaller group of members. These funds would have fewer alternatives to reduce fees, so their continuing operation would be challenged.
A significant failure rate – is that what we should expect?
If we use a 10-year measurement period for investments, we have seen that 27 out of the 82 MySuper funds failed to reach what would seem to be a reasonable performance standard. That is a 33% failure rate. Of those 27, nine also failed the fees test so 11% of MySuper products failed both tests. A further nine funds passed on investments but failed on fees. These results provide an indication of what we may see when APRA’s Heatmap is published next month, although the Heatmap assessment has a wider range of fee measures across different balances and performance measures across different periods and shows gradations in the level of underperformance rather than a ‘pass/fail’.
How could funds respond to a poor outcome in the Heatmap? The fees element is perhaps the easier for funds to rectify, at least for those that have some leeway in terms of the fees they charge – mainly retail funds. The investment performance element is harder for funds to rectify as it may require significant changes to the investment approach. And as we have discussed, the investment performance component is much more sensitive to timing – if investment markets were to tumble and we re-ran the test in say 12 months’ time, we would expect the pass rate would be notably higher as active management should do better than passive.
If the ‘Right to Remain’ approach is adopted rather than the ‘Best in Show’, we believe the issue of underperforming funds can be effectively addressed with the least impact on members already in good funds. Of course, the crucial point will be how high to set the bar to retain a MySuper licence. This paper provides one possible approach. We would not want the relatively high failure rate of our initial analysis to lead to a lowering of expectations across the industry, but clearly there are challenges with the relatively short period of MySuper performance. The industry owes it to members to weed out underperforming funds no matter how painful that may be. It is only by setting some tough but achievable standards that we will truly be able to describe our system as world class.
