Not- for-profit funds have outperformed retail funds over the medium and long term. But have they done so by taking on more risk by significant investments in unlisted property and infrastructure? This article will explore this contentious issue that has been drawing lots of attention in recent months.
The average not-for-profit fund return for a growth option (61-80% growth assets) for the 15 years to 30 September 2018 was 7.8% pa after investment fees and tax, compared with the average retail growth option return of 7.2% pa. If administration fees were also deducted, the difference would be even greater.
While much of the debate is around industry funds’ classifications of unlisted assets, our analysis is extended to not-for-profit funds to broaden the universe given that public sector funds and corporate funds invest in a similar way. However, if we just considered industry funds, the performance differential would increase from 0.6% to 0.8% pa. We also must remember that most default members in retail funds are no longer in growth options but rather in lifecycle MySuper products that vary asset allocation with age.
Not-for-profit funds - a different investment model
How have not-for-profit funds done better? For the answer we need to look back to the 1990s when, with the encouragement of their asset consultants, JANA and Frontier, not-for-profit funds broke free from the traditional reliance on shares, listed property, bonds and cash and made the strategic decision to start investing in unlisted property. This was followed by similar moves into unlisted infrastructure and private equity. These strategic decisions were made partly for reasons of diversification but also to capture the illiquidity premium offered by unlisted assets over their listed counterparts. This strategy has been highly successful, with these investments delivering stronger than expected returns over the medium to long term, along with their diversification benefits. Indeed the timing for not-for profit funds investing in these assets could not have been better – as falling discount rates and increasing demand for such assets since that time have boosted returns.
It would be wrong to suggest that investing in unlisted assets has been the sole driver of not-for-profit funds’ outperformance. Many of these funds have also been astute in their use of dynamic asset allocation and in their manager selection – again with the assistance of their asset consultants. They have used their scale to good effect, too, in negotiating lower fees from their managers and they don’t have the requirement to produce a profit margin for shareholders. But the early strategic move into unlisted assets was a key initiative to unlock long-term value for their members.
Retail funds, meanwhile, generally maintained their focus on listed shares, listed property, bonds and cash. Their main reasons for doing so were twofold. Firstly, they did not have the guaranteed inflows of compulsory contributions that not-for-profit funds enjoyed through modern awards and enterprise bargaining agreements. Secondly, their members tended to be more engaged with their superannuation, made more discretionary contributions and were more likely to switch from one investment option or even from one fund to another, either on their own accord or on the advice of a financial planner. For retail funds, therefore, liquidity was an important consideration in their asset allocation decisions as they needed to have money on hand to pay members if they requested a withdrawal.
Are not-for-profit funds more risky than retail?
There has been much debate in recent times about whether the significant exposures to unlisted assets in not-for-profit funds makes them inherently more risky. The big challenge is how to measure and compare the risk of different investment options.
One commonly used measure to express risk is volatility, which is generally the standard deviation of monthly returns. When we look at this measure over the past ten years, retail fund returns have a standard deviation of 6.7% compared with 5.5% for not-for-profit funds.
Chart 1 which plots the rolling 1 year returns of not-for-profit funds and retail funds in our Growth category, illustrates this. It shows that while not-for-profit and retail performance has tracked a similar path, not-for-profit fund members have had a smoother ride with less extreme highs and lows during major market events.
This seems to suggest that not-for-profit funds are in fact lower risk, not higher. However, this measure isn’t the most useful as not-for-profit funds’ unlisted assets are not valued every month but typically only quarterly or annually. This means that the lower volatility of not-for-profit funds is partly a function of the valuation frequency and methodology of their unlisted assets rather than because their assets are inherently lower risk. However, it could be argued that valuing such assets quarterly gives a more accurate representation of fair value than daily ‘marked to market’ valuations as it removes the impact of market sentiment. The other issue with standard deviation is that it measures short-term price variations rather than the risk of loss which is the primary concern for super fund members.
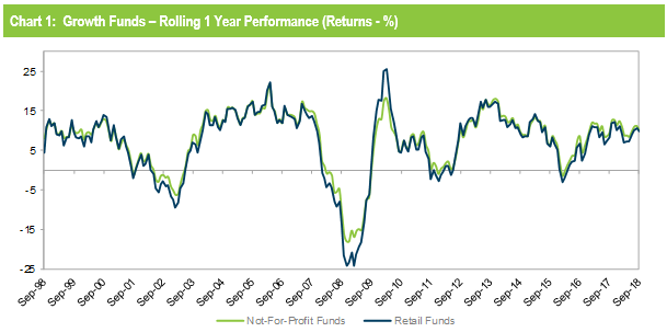
Source: Chant West
Table 1 shows the average strategic asset allocation at June 2018 for not-for-profit and retail funds for growth options (61-80% growth assets), including the split between and defensive assets. It shows there are some significant differences in asset allocations between the two groups, including the nature of their defensive assets.
The most significant differences between the overall asset allocations of the two groups are:
- retail funds have a higher allocation to listed shares, listed property and listed infrastructure at about 62% versus 52% for not-for-profit funds
- not-for-profit funds have much higher allocations to unlisted property, unlisted infrastructure and private equity, at about 20% versus 5% for retail funds
- retail funds have a higher allocation to traditional fixed interest, at about 21% against 12% for not-for-profit funds.
For the purposes of assessing risk, the most important differences are in the composition of the two groups’ defensive assets:
- for retail funds, about 75% of their defensive assets are in traditional fixed interest (21 of 28%)
- for not-for-profit funds, only about 40% of their defensive assets are in traditional fixed interest (12 of 28%)
- not-for-profit funds have 5.5% in defensive unlisted property and infrastructure, which retail funds typically classify as all growth.
Many not-for-profit funds have substituted equities and fixed interest exposure with unlisted property and infrastructure, which most treat as partly defensive. The replacement of fixed interest with unlisted assets, in particular, has been a significant contributor to their outperformance over many years, given that unlisted property and infrastructure have returned 10% and 12% pa respectively over the past seven years against 4.7% and 5.2% pa respectively for Australian and international bonds. Not-for-profit funds also have greater exposure to absolute return hedge funds and alternative debt that they also treat as partly defensive. Retail funds also generally treat absolute return hedge funds and alternative debt as partly defensive but they just have less of them.
The practice of most not-for-profit funds of classifying unlisted assets as partly defensive has been the subject of lively debate, especially in recent months. Some media commentators have accused certain funds of ‘gaming’ the system by presenting a high risk option as a traditional growth option.
In the rest of this article we will assess the practice in more detail. But first, we need to ask the question – why is the industry having this debate at all? Why is it important to have measures of risk like growth/defensive assets?
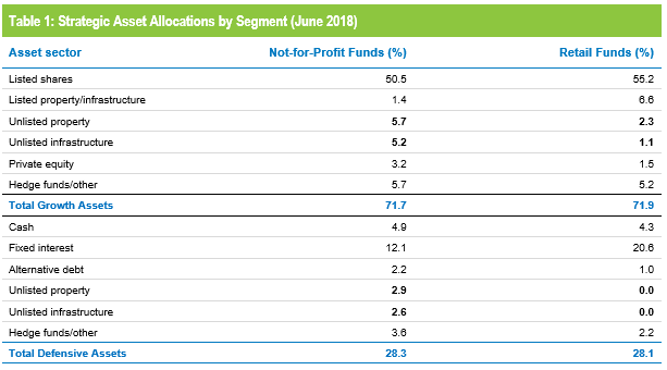
Source: Chant West
Why does it matter?
The growth/defensive split of a fund’s investment portfolio has evolved to become a proxy for risk and is one of the measures used by funds, along with the Standard Risk Measure, to indicate the relative risk of different investment options. It is used by research houses like Chant West to group funds of similar risk for performance comparison purposes. It is also used by financial planners when advising clients on appropriate investment options. There are other measures of risk but they are generally not well-suited to highly diversified portfolios that include assets with infrequent valuations. So growth vs defensive has become a common way to group funds into risk categories, which in turn enables their performance to be measured against their peer group over different time periods.
The classification of assets into a binary state of either growth or defensive has the advantage of simplicity but it has limitations when used as a risk proxy. For starters, it fails to adequately capture diversification which underpins portfolio construction – the risk-reducing attributes that can arise from a suitably chosen combination of assets. Ignoring the diversification benefits and classifying assets into one of two types may overstate the risk inherent in a portfolio. Another issue is that classifications for a number of asset types may change over time depending on market conditions and pricing. As an example, the current low interest rate environment challenges the notion of what is truly defensive.
While it has its shortcomings, it is important that a fund’s published growth/defensive split reflects the relative risks between their own options and options provided by other funds on a consistent basis. This is because it can be advantageous for a fund to be classified in one risk category rather than another. A hypothetical example helps to illustrate the point.
Fund A and Fund B have identical asset allocations, investing in the same asset sectors and in the same proportions, including a total of 12% in unlisted property and infrastructure. The difference is that Fund A classifies all its unlisted property and infrastructure assets as growth, while Fund B classifies it as 50% growth and 50% as defensive. As a result, Fund A has an overall exposure to growth assets of 83%, placing it in our High Growth category (81 – 100% growth assets). Fund B’s overall exposure to growth assets is 77%, placing it in our Growth risk category (61 – 80% growth assets).
The funds are now competing in different categories, with different return expectations. Given ‘normal’ investment markets over the medium to long term, we would expect High Growth funds to deliver higher returns than Growth funds, because of their higher allocations to growth assets. Even if Fund A and B perform identically, Fund A might finish in the 3rd or 4th quartile of the High Growth category but Fund B might finish in the top quartile for the Growth category – all because of the different classification of unlisted assets.
This is a simple example of how a fund may gain a competitive advantage from classifying its unlisted assets in a particular way. Performance surveys are not the be-all and end-all, but they can have an influence on things such as member, adviser and employer product choices, tender outcomes and incentives for fund executives. And, if the Productivity Commission’s proposal to limit default funds to a list of 10 ‘best in show’ products comes to fruition, the temptation to ‘game’ the system will become even greater.
Growth vs defensive - a short history
We have seen that these growth/defensive decisions could have significant commercial implications. The issue then is … who decides what is a growth asset and what is a defensive asset and how are those decisions made? Turn the clock back 25 years and there was no argument. Funds invested in listed shares, listed property trusts, bonds and cash. The first two were growth, the last two were defensive – end of story.
Then from the mid-1990s onwards, when not-for-profit funds started to invest in unlisted property, these assets were initially treated as growth, the same as listed property trusts. But over time the funds, and their asset consultants, realised that the nature of the returns they got from these assets was quite different.
Firstly, they generated a very stable income stream through rents, many of them based on long-term leases, which made them quite bond-like in nature. They had less leverage and development assets than the typical listed property trusts of the time and so were less risky. They were also much less volatile, partly because of the valuation frequency but also because they were valued by professional valuers and were not subject to daily swings in market sentiment.
A similar situation arose with infrastructure. When not-for-profit funds started investing directly in mature assets such as tollways, airports and seaports they did so largely because they generated reliable, bond-like income streams and had the potential for long-term capital growth.
It became clear that the old polar classification of growth or defensive didn’t really work well for these unlisted property and infrastructure assets. They were neither all-growth nor all-defensive. Sometimes they were called ‘mid-risk’ assets, and some funds started to classify them in that way, often designating them 50% growth and 50% defensive. In 2008, ASFA brought out a series of suggestions for the treatment of growth/defensive assets, which also included a 50/50 split for core unlisted property and infrastructure.
How were we, as researchers trying to compare like with like, going to react? Initially we retained the traditional approach and treated them all as 100% growth. But as we learned more about the characteristics of these assets and the make-up of their returns we became more convinced that treating them as partly defensive was justifiable and a better reflection of their true nature.
<br>
<br>Indeed the GFC demonstrated that these assets behave quite differently to other growth assets. Peak-to-trough losses for unlisted property and infrastructure were much lower (in the range of 10% to 25%) than losses for equity markets (about 50%). Listed property losses were even worse – about 70%.
It would clearly be impractical for us to research every asset in every portfolio to determine the validity of each fund’s reported growth/defensive split so we made the decision to accept each fund’s growth/defensive classifications as long as they were reasonable. There have been times when we have not accepted a fund’s classification and have instead treated all unlisted and alternative assets as growth. We acknowledge that this is not an exact science and, in the absence of any regulations governing this area, there are going to be differences of practice and opinion.
What is current practice by funds?
While funds generally disclose the proportions of growth and defensive assets in their portfolios, they are under no obligation to disclose how they determine those proportions. So we decided to ask them. Specifically, we asked them how they classified the following asset sectors and what was their rationale for that classification:
- unlisted property
- unlisted infrastructure
- hedge funds
- absolute return funds
- high yield credit, including emerging market debt
- alternative and other debt.
We received responses from 32 not-for-profit funds (including 24 industry funds) and from eight retail funds.
Table 2 shows the responses from the 32 not-for-profit funds. Significantly, about 45% of funds treated unlisted property and infrastructure as 100% growth (the traditional approach to these assets) and about 40% treated these assets as 50/50. Only one fund treated unlisted property as 100% defensive but it also treated unlisted infrastructure as all growth which achieves a similar overall result as using a 50/50 split for both asset sectors.
The number of responses for hedge funds, absolute return funds, high yield/emerging markets debt and alternative/other debt do not match the total responses figure of 32 as not all funds invest in those sectors. Also some funds have not provided a growth/defensive split for those sectors advising that those sectors could fall into either bucket depending on various risk characteristics.
Table 3 shows the responses for the eight retail funds (including all large retail institutions). Of those, only two out of eight ascribe any defensive component to their unlisted property assets while three do so for unlisted infrastructure. The different approach of these a few retail funds is very recent (since June 2018) as previously all retail funds treated these assets as all growth.
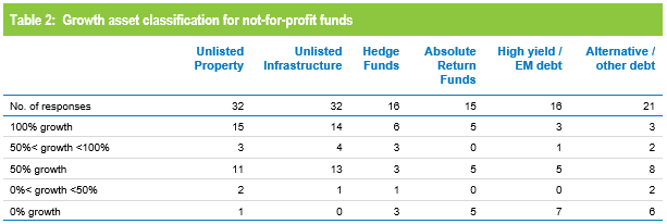
Source: Chant West
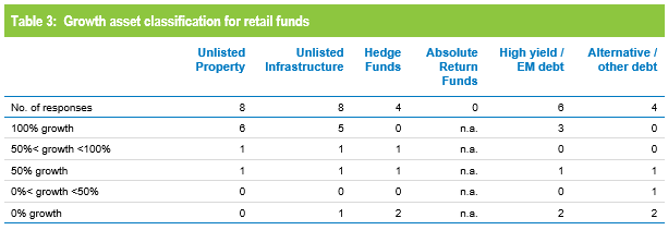
Source: Chant West
For the other asset sectors there was a wider range of practice across both not-for profit funds and retail funds which reflects the more diverse nature of these investments. For example, there is a wide spectrum of hedge funds all the way from absolute return funds that attempt to have little market correlation to portfolios that attempt to magnify any market movements. Similarly, debt assets can have a wide range of risks depending on the region and the relevant security of the debt. Nevertheless, there are few funds that provide splits for these assets other than all growth, all defensive or 50/50.
In determining the classifications, funds collectively used a range of criteria including the following:
- expected volatility
- asset consultant classifications
- prospective returns
- capital growth vs income yield
- stability of income streams
- liquidity
- correlation with listed markets
- degree of leverage
- credit rating
- sensitivity to inflation and economic growth
- expected and maximum potential drawdowns
In the case of unlisted property and infrastructure, most not-for-profit funds base the classifications on their broad asset sector views with only a handful deriving the growth/defensive splits by looking at the characteristics of each individual asset in their portfolio.
One approach used by some of these funds was to calculate the expected contributions to performance from capital growth and income. In principle, this seems to be a sensible approach. The question then is how to translate these two metrics into the growth and defensive percentages. Some funds simply use the expected capital growth as the growth component and the expected income as the defensive component. This overstates the defensive component as it does not take into account the variability of income from each asset, which may be low for regulated infrastructure assets but should be higher for GDP-related infrastructure and most commercial property. Indeed, such an approach would classify shares in the Big 4 banks and Telstra as mostly defensive which is clearly not the case.
We support an approach that considers the portfolio on an asset-by-asset basis using expected contributions from capital growth and income, but we believe more work needs to be done on how to translate these into a growth/defensive allocation for any given asset.
Source: Chant West
Note: Performance is shown net of investment fees and tax. It is before adminisatration fees and adviser commissions.
Do classification differences explain performance differentials?
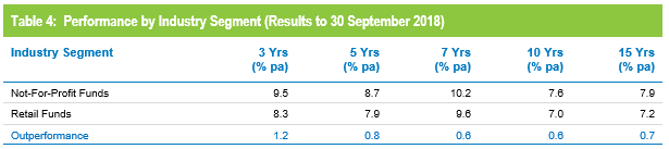
As we have just seen, there are some clear differences between not-for-profit funds and retail funds in their classification of some assets as growth and defensive. But do these classification differences account for the performance gap between the two segments? One simple way to test this is to compare retail fund performance with the performance of 13 not-for-profit funds that classify all their unlisted property and infrastructure as growth, as most retail funds do. We have focused on those two asset sectors as they are the most contentious, given their relatively high allocations in not-for-profit fund portfolios.
This comparison is shown in Table 4. The table shows that not-for-profit funds that classify unlisted property and infrastructure as 100% growth are still comfortably ahead of retail funds over all periods, however this is based on a smaller dataset.
Where to from here?
There are no simple rules to determine whether an asset is growth or defensive, which is why there is so little consistency within the industry. Illiquidity has sometimes been equated with risk but the degree of risk depends on who is investing and what their liquidity needs may be. For example, illiquid assets in a fund with consistently strong cash flows would be less risky than the same assets in a fund with weak cash flows.
While we believe there are valid arguments to classify some unlisted and alternative assets as ‘defensive’, for the benefit of consumers we would welcome greater consistency and transparency in how funds arrive at their growth/defensive mixes. We believe there will be no consistency without prescriptive regulation or at least a comprehensive set of guidelines laid down by APRA or ASIC. That is not likely to eventuate any time soon, so in the meanwhile we would like to see:
- the regulators meeting with the major funds and asset consultants to at least start the process of developing some protocols around the risk classification of non-traditional asset sectors
- funds being required to disclose, in their offer documents and on their websites, their current practice in classifying assets as growth or defensive and the criteria on which they have based their determinations.
Perhaps we should even go further and move away from growth/defensive classifications altogether. We could standardise the Standard Risk measure by requiring the use of standard assumptions. Or should we look at drawdown or peak-to-trough falls as they better reflect true portfolio risk? But there are very few data points to measure on an ex-post basis so it would also rely on a range of assumptions.
Another suggestion that may have merit is allocating risk scores for each asset type, with scores for unlisted assets factoring in type and geographic location. But this is also imperfect as it also doesn’t capture diversification benefits and would face the significant challenge of the industry trying to reach agreement on the risk scores. However, this idea may warrant further attention and would have the advantage of removing us from the heated debate about whether certain assets can be defensive.
Finally, another alternative measure for risk is to consider the correlation between each super fund’s diversified portfolios and equity market returns.
All of this just demonstrates the multi-faceted nature of investment risk. Risk is probably best reflected in a range of complementary metrics. But members probably still need a single measure to reflect how risky an option is, without having to make sense of a few, perhaps contradictory, measures of risk. Indeed a single measure is also required by advisers and research houses to group ‘like’ investment options for investment option selection and performance comparison.
What should that single measure be? A revised and standardised growth/defensive split? Perhaps, but clearly we have a long way to go before we get there. And no matter what path we take, if we are to succeed, we will need all parts of the industry to work together in good faith to arrive at a good outcome.
